AI Token Usage Reports: What to Include
AI token usage reports are essential for tracking and managing costs when using AI tools. These reports help break down expenses, identify inefficiencies, and optimize workflows. Here's what you should know:
- What Are Tokens? Tokens are units used by AI models to process data. Costs vary significantly by model and type of token (input vs. output).
- Why Reports Matter: Without proper tracking, AI costs can spiral. Reports link spending to specific activities, features, and customer accounts, providing actionable insights.
- Metrics to Include:
- Token Volume: Total tokens used, average tokens per request, and cached token ratios.
- Costs: Total spend, cost per 1,000 tokens, and output-to-input cost ratios.
- Breakdowns: Spending by model, feature, and workflow to spot inefficiencies.
- How to Use Reports: Identify high-cost areas, optimize workflows, and forecast budgets to avoid overruns.
- Data Collection: Use provider APIs and application logging to gather detailed usage data.
Properly structured reports make AI spending transparent and manageable, helping teams optimize both costs and performance.
Core Metrics to Include in AI Token Usage Reports
Token Volume Metrics
Tracking token volume is a key step in understanding your AI workload. Start with total input and output tokens consumed over a specific period, as these provide a clear picture of how much you're using the system. Monitoring average tokens per request can help identify workflows that demand more resources, and keeping an eye on total requests reveals usage trends over time.
Another critical metric is the cached token ratio, which highlights how efficiently your system uses cached prompts instead of reprocessing input tokens from scratch. A low cached-token ratio often signals that your prompt architecture could use some refinement. For more specialized use cases, such as advanced reasoning models or real-time voice applications, it's essential to track reasoning tokens and audio tokens separately. These tokens are billed differently and can significantly impact your expenses.
Together, these metrics lay the groundwork for understanding the cost dynamics of your AI operations.
Cost Metrics
While token volume gives you a sense of scale, cost metrics tell you what that scale translates to in dollars. Always include total spend in USD, but for deeper insights, focus on cost per 1,000 tokens, broken down into input and output categories.
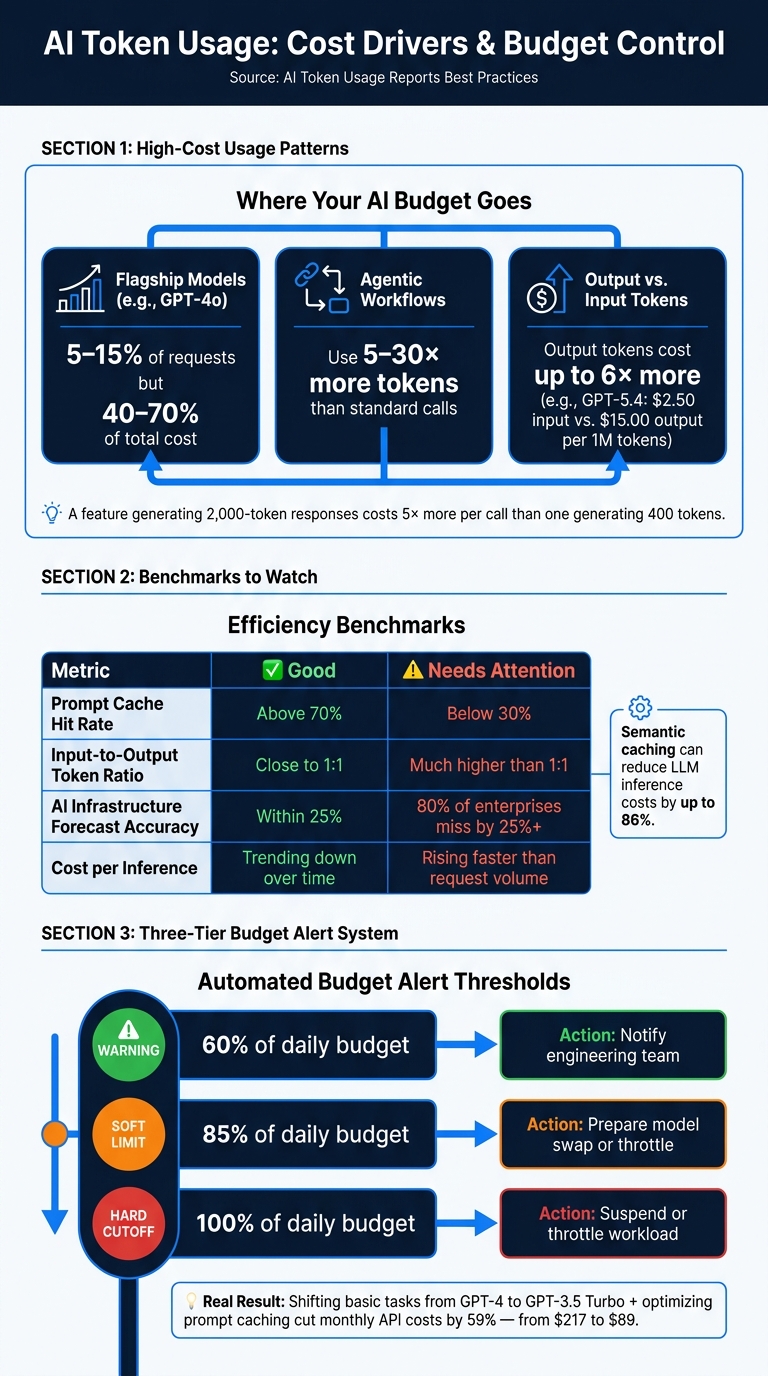
This breakdown is vital because output tokens typically cost much more than input tokens. For instance, GPT-5.4 charges $2.50 per 1 million input tokens but $15.00 per 1 million output tokens. If your costs are climbing faster than your request volume, the output-to-input ratio might reveal why. Combined figures often hide these crucial cost drivers.
"A company spending $100,000 monthly on 10 million inferences ($0.01 per inference) has better unit economics than one spending $50,000 on 2 million inferences ($0.025 per inference)." - Trussed AI
To manage costs effectively, shift the focus from total spend to unit cost metrics like cost per inference or cost per customer interaction. These metrics allow you to compare efficiency across teams, features, and time periods, making it easier to pinpoint areas for improvement.
For even more actionable insights, break these costs down by model and workflow.
Breakdown by Model and Workflow
High-level cost figures often obscure the details that matter most. Breaking down costs by model and workflow can reveal where your budget is being spent and why.
Flagship models like GPT-4o are a great example. They might account for only 5–15% of requests but can consume 40–70% of your budget. This happens when teams default to using the most capable model during development and fail to reassess whether a simpler model would suffice. A weekly breakdown of spending by model can expose these inefficiencies.
| Metric | What It Reveals |
|---|---|
| Input/Output tokens per model | Whether costs are driven by lengthy prompts or verbose responses |
| Cached tokens per model | How well prompt engineering and cache utilization are working |
| Cost per model | Which models are taking up the largest share of the budget |
| Tokens per workflow/feature | Which product features are the most expensive to operate |
On the workflow side, tagging requests by feature - such as "chat", "summarization", or "search" - helps identify which parts of your product are the most resource-intensive. This granular level of detail is essential for targeted cost optimizations.
"GPT-4o is usually 5–15% of requests but 40–70% of cost. It gets used where gpt-4o-mini would have been fine, because teams default to the latest flagship model during development and never revisit the decision." - LLMeter
Without breaking down costs in this way, efforts to control spending often become a guessing game.
LLM Observability Made Easy | AI Token Usage, Cost Control & Dashboards
How to Structure and Format AI Token Usage Reports
Organizing token data into a clear and structured report is essential for translating raw numbers into actionable steps for cutting costs and improving efficiency.
Key Sections to Include in Your Report
A well-organized report ensures that everyone - whether engineers, product managers, or finance teams - can quickly access the information they need. Start with an executive summary that highlights the total spend in USD, total tokens consumed, and a high-level cache ratio. This section provides a quick snapshot of financial performance without requiring a deep dive into the details.
Follow this with a model and cost breakdown to identify which models contribute most to expenses. Next, include a feature or tag view that links costs to specific product areas, like "search" or "onboarding." Wrap up with a trends and anomalies section, featuring daily or weekly charts to help spot unexpected spikes before they turn into costly surprises. For even deeper insights, add a per-customer breakdown - you might find that a single account accounts for 30–50% of your total AI spend once you start tracking usage at this level.
| Report Section | Key Metrics | Purpose |
|---|---|---|
| Executive Summary | Total USD spend, total tokens, cache ratio | Provides a quick overview of financial health |
| Model Breakdown | Spend per model, request volume | Identifies costly or underused models |
| Feature/Tag View | Cost per feature tag (e.g., "chat", "search") | Pinpoints resource-heavy product areas |
| Trend Analysis | Daily/weekly spend charts | Detects anomalies and usage spikes |
These sections provide a solid foundation for your report. From here, selecting the right time frames can further refine your analysis.
Time Periods and Date Views
Different teams benefit from different time perspectives. Daily views are ideal for engineering and DevOps teams - they allow for quick identification of issues like runaway agents or abusive accounts that could inflate your monthly bill. Weekly views work well for product managers who need to measure the impact of recent prompt optimizations on costs. Meanwhile, monthly views are more suitable for finance teams handling budget reconciliation and expense tracking.
Keep in mind, most AI providers report data in UTC, which means daily totals might roll over at 7:00 PM or 8:00 PM ET. If your internal billing operates on local time, consider pulling an extra day on either side of your date range to manually adjust for discrepancies. For reports covering over 90 days, switch from daily to monthly buckets to maintain readability and highlight long-term trends.
Once you've settled on time frames, the next step is choosing the right format and delivery method for your audience.
Report Formats and Delivery Methods
The format of your report should match the needs of your audience. Dashboards are perfect for teams that need frequent updates - they allow for interactive filtering by model, date, or feature tag. For documentation or sharing in tools like Slack or Notion, Markdown and PDF exports are more suitable. When integrating with finance or BI systems, JSON outputs are the way to go, as they can feed directly into cost-allocation pipelines without extra formatting.
"OpenAI's usage dashboard gives you a total spend number and a per-day bar chart... but it answers exactly one question: 'How much did we spend this month?'" - LLMeter
To highlight areas for optimization, rank model breakdowns by total tokens consumed. For executive presentations, consider exporting key charts as SVGs or images - they’re clean, easy to incorporate into slides, and require no additional formatting.
sbb-itb-903b5f2
How to Collect Data for Token Usage Reports
Creating effective usage reports starts with accurate data collection. You can achieve this through two main methods: pulling data directly from your AI provider or logging usage within your own applications.
Using Provider Dashboards and APIs
Most major AI providers offer dedicated usage endpoints that allow you to retrieve exact token counts and costs. These endpoints can be queried programmatically, making the process efficient and secure without intercepting actual traffic.
| Provider | Usage Endpoint | Key Requirement |
|---|---|---|
| OpenAI | https://api.openai.com/v1/usage |
Admin/Service Account Key |
| Anthropic | https://api.anthropic.com/v1/usage |
Standard API Key |
| Google Gemini | usageMetadata in response body |
Standard API Key |
| OpenRouter | https://openrouter.ai/api/v1/usage |
Standard API Key |
To automate the process, set up a cron job to query these endpoints hourly and store the results in a time-series table. This ensures consistent data collection over time. For added security, use read-only or "Service Account" API keys. These keys are restricted to billing data access and cannot initiate model calls, reducing risks if a key is compromised.
While these dashboards are useful, they don’t provide detailed attribution data, which is where application logging comes in.
Application and Workflow Logging
To achieve more detailed insights, log token usage directly from your applications. Most major language model SDKs return a usage object with details like prompt_tokens and completion_tokens for every response. Adding a logging layer to your AI client calls allows you to capture this metadata.
What makes this approach especially valuable is tagging. By including fields like customer_id, project_id, and feature_name, you can pinpoint which features or customer accounts are driving costs. For production environments, JSONL files are a practical choice for logging. They support atomic writes from multiple processes and can be queried later using tools like DuckDB or SQLite. This setup lets you capture usage data in real time and aggregate it later for streamlined reporting.
If you're looking for tools to simplify local data management, the following option might be worth considering.
NanoGPT as a Reporting Tool
NanoGPT offers a pay-as-you-go model, which helps keep your spending transparent and easy to manage. Since it stores data locally on your device rather than relying on third-party servers, it’s a good fit for privacy-conscious users who want to avoid external monitoring.
NanoGPT’s API responses include an x_nanogpt_pricing object with fields like amount, currency, and paymentSource, making cost tracking straightforward. Additionally, its /api/subscription/v1/usage endpoint provides real-time data on units consumed and reset timestamps. This setup gives you everything you need to create detailed local reports without relying on external analytics layers.
How to Use Token Usage Reports to Cut Costs and Improve Efficiency
AI Token Usage Report: Key Metrics, Cost Drivers & Budget Alert Thresholds
Turn token data into smarter decisions that save money and boost productivity.
Finding High-Cost Areas in Your Usage
Models like gpt-4o often account for just 5–15% of requests but can drive 40–70% of total costs. Without tracking costs by feature or model, this imbalance can go unnoticed.
"A feature generating 2,000-token responses costs 5× more per call than one generating 400 tokens, even if the input price remains the same. Per-feature breakdown makes this visible before it becomes a scaling problem." - LLMeter
Agentic workflows, which involve multiple cascading model calls, can use 5 to 30 times more tokens than standard interactions. If one workflow consumes a disproportionate share of tokens, it’s worth analyzing whether every step truly requires a high-end model.
Take the example of Brian Munene Mwirigi, who cut his monthly AI API costs by 59% - from $217 to $89 - by shifting basic tasks from GPT-4 to GPT-3.5 Turbo and optimizing prompt caching in January 2026.
Pay attention to your prompt cache hit rate. A rate below 30% suggests unnecessary regeneration of system prompts. Introducing semantic caching can slash LLM inference costs by as much as 86%.
Spotting these cost drivers allows you to better plan your budget and avoid unexpected expenses.
Forecasting and Budgeting with Token Data
Once you’ve identified high-cost areas, use token data to improve forecasting and budgeting. 80% of enterprises miss their AI infrastructure forecasts by over 25%.
"A single user query that costs $0.02 in development can reach $0.50 in production once context history and agent orchestration are factored in." - Trussed AI
Daily budgets and weekly rolling averages can help detect anomalies early. For example, you can set alerts when a user nears 85% of their daily budget. A three-tier alert system can help teams respond quickly and avoid overruns:
| Alert Tier | Threshold | Automated Action |
|---|---|---|
| Warning | 60% of daily budget | Notify engineering team |
| Soft Limit | 85% of daily budget | Prepare model swap or throttle |
| Hard Cutoff | 100% of daily budget | Suspend or throttle workload |
Models like Sonnet-class tend to have output tokens that are 3 to 5 times more expensive. If your product generates long responses, make sure your forecasts account for this.
Benchmarking Your Token Usage
Forecasting is just the beginning - benchmarking helps ensure your usage stays efficient. Track metrics like cost per user, cost per output, and p99 cost per API endpoint to identify inefficiencies. For example, a prompt cache hit rate above 70% is a sign of good optimization, while an input-to-output token ratio much higher than 1:1 could indicate waste.
"In multi-tenant SaaS products, a single power user often generates 5–20% of total Claude spend. Without per-customer attribution, that customer is invisibly subsidized by everyone else." - LLMeter
Review your benchmarks quarterly. Token prices are trending downward, so what was once an acceptable cost-per-query may now be too high with newer, more affordable models. Regular audits can also catch inefficiencies like "prompt bloat", where a system prompt quietly triples in size over a couple of weeks without anyone noticing.
Conclusion: Key Takeaways for AI Token Usage Reports
A well-structured token usage report can turn raw data into meaningful insights. Without clear visibility into spending, 80% of organizations fail to see measurable EBIT impact.
As Tokenr aptly states:
"You cannot optimize what you cannot measure."
Understanding which models, features, or workflows are driving costs allows you to take decisive action. This could mean shifting tasks to more budget-friendly models, improving cache efficiency, or controlling unexpected expenses. Such transparency is crucial for maintaining cost-effective AI operations.
When creating your reports, focus on key metrics like cost per feature, model-level breakdowns, and prompt cache hit rates. Track usage daily instead of waiting for a 30-day billing cycle. Also, account for infrastructure overhead and growth by applying a 1.7x–2.0x multiplier to raw API estimates. These steps help align projected and actual spending.
For teams prioritizing privacy and simplicity, NanoGPT offers a straightforward solution. Its x_nanogpt_pricing response object provides precise cost and token counts for each request, while the count_tokens endpoint lets you estimate costs before making a call. Additionally, all usage data is stored locally, ensuring sensitive consumption details remain under your control.
FAQs
How do I allocate token costs per customer and feature?
To manage token costs on NanoGPT, leverage metadata tagging and team-based account structures. By tagging API calls with customer IDs, you can calculate ROI and margins for individual clients more effectively. Additionally, the Teams feature allows you to create dedicated teams for specific client projects, ensuring accurate cost tracking, enforcing budgets, and generating detailed usage reports. Cost allocation tags are also a helpful tool for monitoring project-level expenses with precision.
What cache hit rate should I target to reduce spend?
To achieve optimal performance, aim for a cache hit rate of at least 30% for prompts that are used often. For workloads with stable prompts, hit rates can climb to 70% or more, and certain architectures have even surpassed 84%.
To boost your hit rate, focus on stabilizing the prompt prefixes. Place consistent elements, such as instructions or schemas, at the beginning of your prompts. On the other hand, steer clear of including changing data, like timestamps, early in the prompt. These volatile elements can disrupt the cache and reduce overall efficiency.
How can I forecast next month’s AI bill from tokens?
To estimate next month’s AI expenses, start by examining past usage patterns - look at request volumes and the costs associated with different models. Leverage tools that allow you to break down spending by model or feature, and use metadata tags (like customer IDs) on API calls to identify what’s driving costs.
For real-time insights, NanoGPT’s token tracking feature is incredibly useful. It lets you monitor usage trends and set budget alerts at key milestones, such as 50%, 75%, and 90% of your planned spending limit. This approach helps you stay on top of costs and manage your budget more effectively.