Checklist for Choosing AI Models for Carbon Tracking
Pick the model that fits your reporting job first. If it can’t work with your data, boundary, audit needs, and privacy rules, price does not matter.
Here’s the short version: I’d judge any model on four things:
- Data fit: Can it handle bills, PDFs, ERP exports, supplier files, and missing data?
- Accuracy and proof: Can I see how the numbers were tested, including token use, hardware, and emission factors?
- Speed, privacy, and compute: Can it run at the volume I need without slowdowns or data-policy problems?
- Cost: Does pricing fit my usage, including staff time, setup, and review?
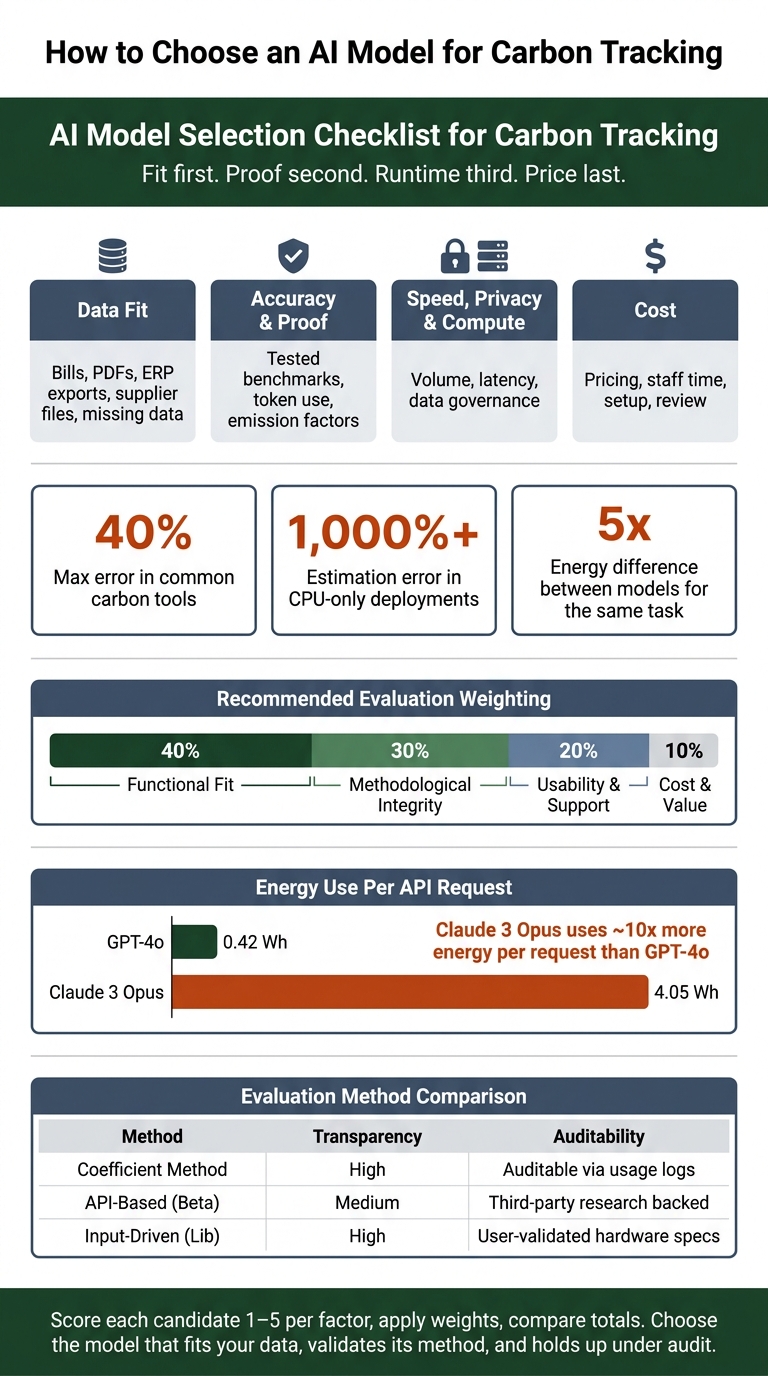
A few numbers stand out. Some carbon tools can be off by up to 40%. CPU-only estimates may miss by more than 1,000%. And one model can use 5x the energy of another for the same task. That’s why I’d score fit and measurement before I look at monthly spend.
If I were choosing, I’d use a simple rule: fit first, proof second, runtime third, price last. Then I’d score each option on functional fit (40%), method quality (30%), team use and support (20%), and cost/value (10%).
AI Model Evaluation Scorecard for Carbon Tracking
Measuring AI's Carbon Footprint and Impact with CodeCarbon & Eco2AI
sbb-itb-903b5f2
Quick Comparison
| Check area | What I’d ask | Why it matters |
|---|---|---|
| Data fit | Can it read structured and unstructured records? | Bad inputs lead to bad output |
| Reporting boundary | Does it support Scope 1, 2, 3 and my consolidation method? | Boundary mismatch changes totals |
| Accuracy | Were results tested on the same hardware and setup I use? | Benchmarks may not carry over |
| Emissions method | Does it show token counts, factor versions, and reasoning-token treatment? | I need figures I can defend |
| Validation | Is there third-party evidence? | Vendor claims alone are weak |
| Efficiency | How much energy, latency, and compute does it need? | Inference drives most lifetime emissions |
| Privacy | Can I keep data local if needed? | Finance and supplier data may be sensitive |
| Cost | Does pricing match report volume and output length? | API costs can climb fast |
Below, I’d turn that checklist into a simple buying decision you can use without getting lost in model names.
Checklist Step 1: Match the Model to Your Carbon Data and Outputs
Start with data fit. Every choice after that depends on it.
Check Supported Data Sources and Data Quality Tolerance
Carbon inventories often pull from a messy mix of sources: utility bills, fuel receipts, ERP exports, supplier files, sensor feeds, travel records, logistics data, cloud data, and HR systems.
That means the model can't just work with neat spreadsheets. It should also handle document extraction and NLP so it can pull figures from scanned PDFs and other unstructured files. Just as important, it needs to clean up naming issues. For example, it should be able to map labels like "ULP 95" or "ADO" to the right fuel factor.
Good models also know what to do when data is missing. If activity data isn't there, they can fall back to spend-based or average factors, then flag those records for review. That kind of fallback keeps work moving without hiding weaker inputs.
Check the Output Format Your Workflow Needs
A model can produce accurate estimates and still be the wrong fit if the output doesn't work for your team.
Common outputs include:
- Numeric emission estimates
- Anomaly flags
- Predictive forecasts
- Scenario models for reduction pathways
For many teams, audit-ready exports matter most, especially for SEC climate disclosures and internal sustainability reports. In plain terms, you need a full audit trail: the figure, the method, the factor version, and the source document.
On the export side, check for CSV, JSON, or XBRL support. XBRL matters a lot if your organization falls under financial-grade climate disclosure rules. Organizations using platforms with built-in audit trail features have reported 30% to 50% cuts in third-party verification costs.
Check Whether the Model Fits Your Emissions Boundary
A boundary mismatch can ruin an otherwise good setup. The model needs to match what you're measuring, not just the emissions category or consolidation method.
If your team reports under Operational Control, Financial Control, or Equity Share, the model has to support that exact approach. Those methods produce different numbers, so this isn't a small detail.
For Scope 2, make sure the model can report location-based and market-based figures separately. And if purchased goods or logistics make up most of your footprint, put more weight on activity-based supply chain estimation than on facility-only monitoring.
Once the boundary lines up, the next step is checking how the model measures results and shows its work.
Checklist Step 2: Verify Accuracy, Measurement Method, and Validation
Now it’s time to test whether the model’s emissions numbers can hold up under review.
Check the Benchmark and Evaluation Method
Once the data source and system boundary make sense, check the numbers before you trust them. Don’t accept accuracy claims without seeing how the test was run. Common tools can be off by as much as 40%.
Dynamic profilers usually track usage better than static calculators. But they still may undercount total energy by 20% to 30% because they miss hardware overhead. And for CPU-only deployments, estimation errors can go beyond 1,000%.
Hardware match matters too. If the benchmark used different hardware than your setup, the result may not carry over. For example, an NVIDIA H100 and an A100 have meaningfully different throughput and energy-per-token profiles, so a benchmark on one won’t map cleanly to the other.
Check Transparency for Energy and Emissions Metrics
A good approach is token-based accounting. That means taking activity data, like input and output token counts, and converting it into CO2e with documented emission factors listed as gCO2e per 1,000 tokens. If a provider can’t show that coefficient table, the number becomes hard to defend in any review.
You should also check how the provider handles reasoning tokens. Models like o3 and DeepSeek-R1 generate internal "thinking" tokens that don’t appear in the visible output but still use energy. Systems that can be checked apply multipliers, usually 4x to 10x, to reflect that hidden overhead. Leave out that multiplier, and emissions from reasoning models will look lower than they are. That gap can easily surface in your disclosed figures.
There’s one more detail that’s easy to miss: grid intensity resolution. Use regional grid-intensity data when you can. National averages can smooth over big emissions differences from one area to another .
Check for Third-Party Validation or Audit Evidence
At the moment, there’s no universal standard or public database for AI energy ratings. So third-party benchmarks are the closest thing you have to an outside reference.
Look for results from projects like ML.Energy (University of Michigan), AI Energy Score (Hugging Face), or MLPerf Power instead of leaning on provider-published sustainability labels . With closed-source models, energy use and data center details are often treated as proprietary. In practice, that means third-party estimators are often the fallback option.
The table below shows how common evaluation methods stack up for carbon reporting:
| Evaluation Method | Benchmark Quality | Transparency | Validation Status |
|---|---|---|---|
| Coefficient Method | High - traceable to tokens | High - documented factors | Auditable via usage logs |
| API-Based (Beta) | Medium - research-based | Medium - tier-based estimates | Third-party research backed |
| Input-Driven (Lib) | High - deterministic | High - open-source logic | User-validated hardware specs |
If a model’s validation rests on FLOPs or parameter counts alone, treat its carbon figures as directional at best. That’s not enough for formal disclosure.
Once the method checks out, move on to latency, privacy, and compute fit.
Checklist Step 3: Confirm Efficiency, Privacy, and Deployment Fit
With accuracy and validation already covered, the next step is simple: make sure the model can handle your needed volume and response time without creating privacy or infrastructure headaches. This part matters a lot for emissions, too. Inference drives most of an LLM's lifetime emissions, so deployment choices carry a lot of weight in carbon tracking.
Check Model Size, Latency, and Compute Demand
The same task can use 5x more energy depending on the model. For routine carbon-tracking work - classifying records, filling data gaps, or flagging anomalies - a smaller model often makes more sense.
The gap can be big. A standard GPT-4o query uses about 0.42 Wh per request, while Claude 3 Opus uses almost 10x more at 4.05 Wh.
A practical setup looks like this:
- Send simple classification or extraction work to a lightweight model
- Save deeper reasoning for edge cases
That helps keep total energy use under control as volume grows. And when you estimate compute demand, pay close attention to output tokens. They should count about 4x more than input tokens because text generation takes more compute than text processing.
If a smaller model still doesn't satisfy privacy or governance rules, local processing may be the better path.
Check Local or Low-Data-Transfer Workflow Options
If your carbon tracking relies on internal financial records, facility data, or supplier contracts, governance can become a hard limit. Sending that data to an outside API may clash with privacy policies or compliance rules.
In those cases, local processing deserves a close look. Tools like CodeCarbon track power use and produce direct CO₂-equivalent figures without sending data off your systems. Lightweight open-source models in the 135M to 1.7B parameter range can handle many tracking tasks locally. And small models such as LLaMA-3.2 1B/3B can emit less than 0.3 grams of CO₂ per query.
There's one catch worth checking before you commit to local hosting: the carbon intensity of your local grid. If your site runs on a coal-heavy grid, local inference can produce more emissions than a cloud data center powered by renewables. Tools like electricitymap.org show real-time regional intensity data, which makes that comparison much easier.
For teams that want room to test options before setting up fixed infrastructure, a pay-as-you-go layer can help.
Check Whether NanoGPT Fits Your Evaluation Workflow

NanoGPT uses a pay-as-you-go model, so it's easier to compare how different models handle your carbon data inputs without locking in upfront costs. NanoGPT works best as an evaluation layer for ad hoc carbon-tracking tests, with data stored locally on the user's device.
Checklist Step 4: Make the Final Cost and Reporting Decision
Check Whether the Cost Model Matches Your Usage Pattern
Cost should be the last filter, not the first. But it still has a direct effect on the choice you make.
The main issue is simple: does the pricing model line up with how you’ll use the tool day to day?
With token pricing, output often costs more than input. So if your team generates long reports, costs can climb fast. Per-query pricing may look small at first, but at scale those charges stack up. Usage-based pricing can work well for irregular or exploratory work. For steady reporting, fixed pricing is often easier to predict. The right fit comes down to whether your workload is seasonal, continuous, or tied to specific projects.
Total cost goes beyond the software bill. It also includes implementation, training, and staff time. If your reports need third-party assurance, include human review and audit-ready documentation in that budget too. In many cases, manual data entry is still the biggest source of both cost and error.
Once you’ve got a clear view of cost, compare each model against the full set of trade-offs - not price alone.
Use a Simple Scorecard Before Choosing
A scorecard helps you compare candidates on the same basis. It keeps the decision grounded and stops one flashy feature from stealing the show.
A practical weighting from carbon accounting practitioners assigns:
- Functional fit: 40%
- Methodological integrity: 30%
- Usability & support: 20%
- Cost & value: 10%
Use this scorecard:
| Evaluation Factor | Weight | What to Check |
|---|---|---|
| Functional fit | 40% | Does it meet your core requirements and handle your data sources, formats, and emissions boundary? |
| Methodological integrity | 30% | Does it follow your reporting method and emission-factor rules? |
| Usability & support | 20% | Will your team actually use it? Is onboarding realistic? |
| Cost & value | 10% | Does the pricing model align with your usage pattern? |
Score each candidate from 1 to 5 for each factor, apply the weights, and compare the totals. That makes trade-offs easier to see.
Even then, the top-scoring option should still pass the audit and workflow test.
Conclusion: Choose the Model That Is Accurate, Efficient, and Usable
The best model is the one that fits your data, works with your reporting process, and holds up under audit review. Choose based on fit, validation, efficiency, and cost - not model brand.
FAQs
How do I know if a model fits my carbon data?
Start by getting your carbon data clean and sorted by source, like energy meters, ERP records, and shipping manifests.
Then look at the model itself. It should be transparent, cover your reporting scopes, connect with your current systems, and keep clear audit trails. A pilot project is a smart way to test output against measured benchmarks, check compliance, and build stakeholder confidence.
What proof should I ask for before trusting emissions estimates?
Ask vendors to be open about their data sources, methods, and assumptions. They should spell out which emissions factor databases they use, how often those databases are updated, and whether their approach lines up with standards like the GHG Protocol, PCAF, or ISSB.
You’ll also want to check that the system leaves an auditable trail instead of working like a black box. In plain terms, you should be able to see how it got to a number. Human oversight matters here, so the platform should also allow manual overrides and support third-party audits.
When is local AI processing better for carbon tracking?
Local AI processing is a better fit for carbon tracking when privacy, cost control, and transparency matter most. You run the model on your own machine, so your data stays there. And you avoid recurring API fees, which makes spending easier to predict.
You also get a clearer view of how the model behaves and how many resources it uses. That makes it easier to line up each inference task with a set carbon budget by choosing efficient or lightweight models. NanoGPT also supports privacy-focused workflows by keeping data stored locally on your device.