
Compiler Optimizations for AI Models
If you want AI models to run faster, the biggest gains usually come from the compiler stack - not the model itself.
I’d sum it up like this: compilers cut wasted work, fuse repeated ops, trim memory traffic, and map math to the CPU or GPU instructions your hardware can run best. In the article, the clearest wins came from fusion, layout tuning, SIMD/vectorization, and lower precision like BF16 or INT8.
A few numbers stand out:
torch.compile()cut steady-state time to 21.99 ms in one nanoGPT test, with a 1.5x–2x speedup- Padding sizes to multiples of 64 gave about a 25% speed gain in one case
- Moving from FP32 to BF16 can deliver about 2x–4x more throughput
- INT8 can reach about 4x–8x more throughput when accuracy tradeoffs are okay
- In one NanoGPT setup, inference jumped from 580 tokens/sec to 14,000+ tokens/sec after kernel and cache-related changes
Here’s the short version of what matters most:
- Graph cleanup first: fuse ops, fold constants, remove dead code
- Memory layout next: align tensor shapes for cache and vector units
- Instruction targeting after that: use AVX-512, BF16, INT8, or Tensor Cores when supported
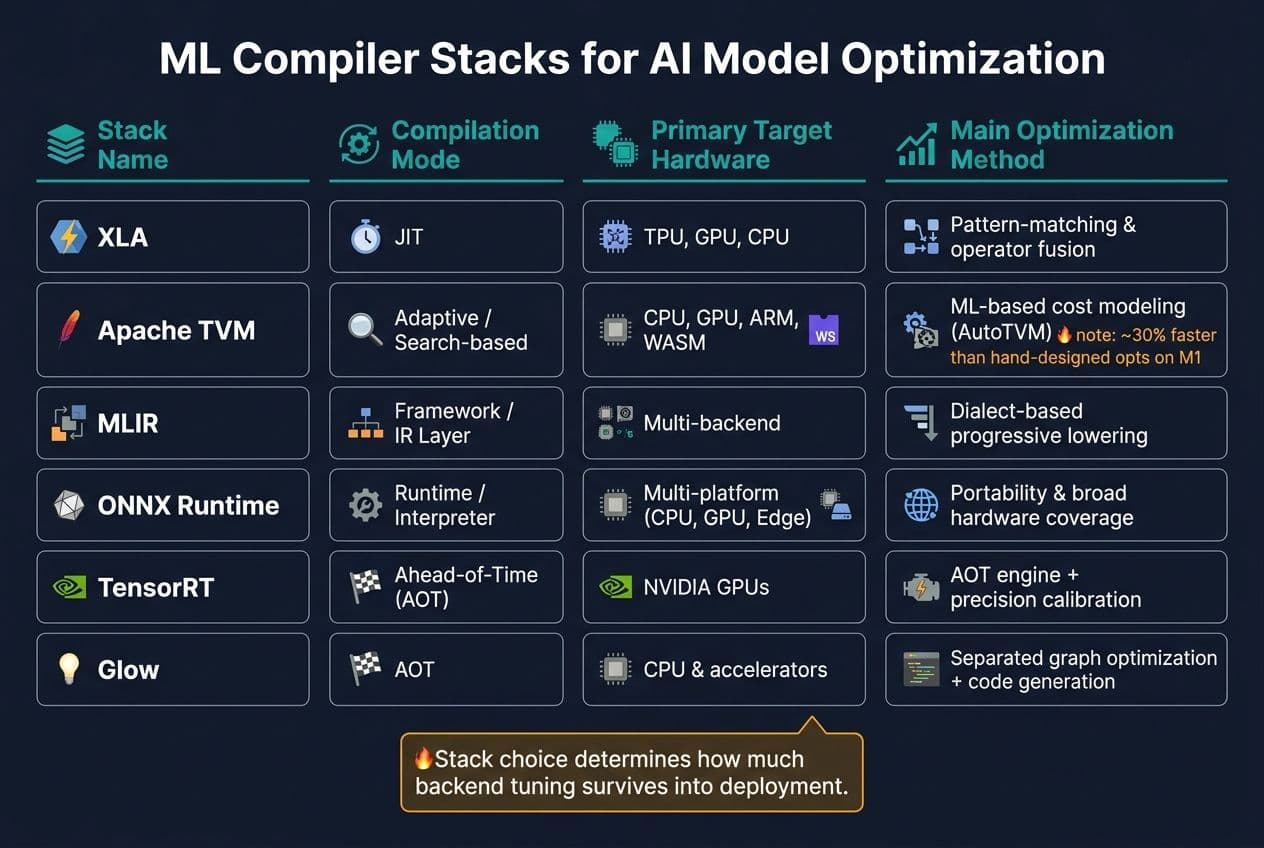
- Pick the right stack: XLA, TVM, MLIR, ONNX Runtime, TensorRT, and Glow each fit a different deployment path
- Always measure: track latency, throughput, cache misses, and output quality after each change
If I were applying this on a local machine, I’d use a simple flow: profile → compile → test precision → validate output. That’s the core idea of the whole piece, without the extra detail.
| Area | What it does | Main result |
|---|---|---|
| Graph passes | Fusion, folding, dead code removal | Less wasted work |
| Layout tuning | Better tensor alignment | Lower memory stalls |
| CPU/GPU targeting | SIMD, AVX-512, BF16, INT8, Tensor Cores | More math per cycle |
| Compiler stack | XLA, TVM, MLIR, ONNX Runtime, TensorRT, Glow | Better fit for deployment |
| Validation | Benchmarks + accuracy checks | Confirms the gain is real |
If you care about local AI, this matters for one more reason: faster on-device inference means you keep data on your own system without taking such a big performance hit.
Optimizing AI Inference with ML Compilers & Hardware | Milan Stankic | DSC EUROPE 24
Core Compiler Passes That Improve AI Model Performance
After graph-level cleanup, the next gains come from memory layout and instruction-level execution. Before a model runs inference, the compiler runs a set of transformation passes on the computation graph. Each one strips out a different kind of waste: extra writes, unused nodes, or poor memory layouts. The end result is a smaller, faster execution plan.
Operator Fusion, Constant Folding, and Dead Code Elimination
Fusion is one of the first graph-level passes. Instead of running matrix multiply, bias add, and activation as separate steps, the compiler combines them into a single kernel. That cuts dispatch overhead and keeps intermediate results from being written back to memory.
Constant folding takes care of subgraphs whose outputs never change at runtime. The compiler computes them ahead of time and hardcodes the result. Dead code elimination removes nodes whose outputs aren't used anywhere else.
Put together, these passes trim the graph, reduce instruction count, and shrink memory use without changing the model's intended numerical behavior.
Fusion, constant folding, and dead code elimination are the base layer of graph cleanup before code generation starts.
Layout and Shape Optimizations for Cache-Friendly Execution
Tensor layout has a direct effect on throughput because it controls how memory is accessed. If data is scattered or poorly aligned, execution can stall. Padding tensor dimensions to 64- or 128-element boundaries helps with alignment and SIMD use.
"The most dramatic optimization to nanoGPT so far (~25% speedup) is to simply increase the vocab size from 50257 to 50304 (nearest multiple of 64)." - Andrej Karpathy
The same idea applies to hidden layer dimensions and batch sizes. Rounding them up to the nearest multiple of 64 or 128 can help push throughput higher.
Once the graph is smaller and better aligned, the compiler can target CPU vector instructions more effectively.
CPU Instruction-Set Optimization: SIMD, AVX-512, BF16, and INT8
Once tensors are aligned well, the compiler’s next job is to map each operation to CPU instructions the chip can run fast. This is the stage where tensor ops become CPU instructions, and the compiler picks vector width, precision, and scheduling. With layout already set, it can focus on SIMD width, cache reuse, and how work should be split across cores.
Vectorization and Loop Transformations for Hot Kernels
Modern CPUs can handle multiple values in one instruction with SIMD (Single Instruction, Multiple Data) units. Compilers use auto-vectorization to map elementwise and reduction ops to AVX-512 vector instructions when the hardware supports them.
For compute-heavy kernels like matrix multiplication (GEMM), attention, and convolution, two loop changes matter most: loop tiling and loop unrolling.
Loop tiling cuts large matrices into smaller blocks that fit in L1/L2 cache. That keeps data close to the core, so it can be reused instead of pulled from main memory over and over. Loop unrolling cuts branch overhead by repeating the loop body several times. It’s a simple idea, but it helps hot kernels spend more time doing math and less time managing control flow.
Low-Precision Execution and Quantization-Aware Compilation
Moving from FP32 to a lower-precision format changes the instruction path the compiler can use. Modern compiler stacks can detect hardware support and choose the fastest path the CPU can run.
- FP32: Standard AVX/AVX-512; baseline throughput; highest precision
- BF16: AVX-512 BF16 / AMX; roughly 2x–4x faster; same dynamic range as FP32 with minimal accuracy impact
- INT8: AVX-512 VNNI; roughly 4x–8x faster; requires per-tensor scaling and accepts some accuracy loss
The compiler then chooses the widest supported path the CPU can execute correctly. That choice matters a lot. On one machine, BF16 may be the sweet spot. On another, INT8 may deliver the best speed if the model can handle the drop in precision.
Threading, Scheduling, and Register Allocation
Vectorization is only part of the story. The backend also has to divide work across cores and keep hot data in registers instead of sending it back to memory. Compiler backends manage threading and parallelism across CPU cores, which cuts the cost of moving intermediate values between operations.
To check whether these optimizations are paying off, track latency, throughput, and cache-miss rate on local CPUs. If those numbers don’t move in the right direction, something in the instruction path, memory behavior, or core scheduling is likely holding things back.
These backend choices differ across compiler stacks, and that often decides how much of the CPU speedup survives into deployment.
sbb-itb-903b5f2
How Major ML Compiler Stacks Optimize AI Models
ML Compiler Stacks Compared: XLA vs TVM vs MLIR vs ONNX Runtime vs TensorRT vs Glow
Compiler stack choice shapes how much backend tuning actually makes it into inference. Once instruction-level tuning is done, the stack decides how those gains get packaged, reused, and shipped.
XLA, TVM, and MLIR-Based Pipelines
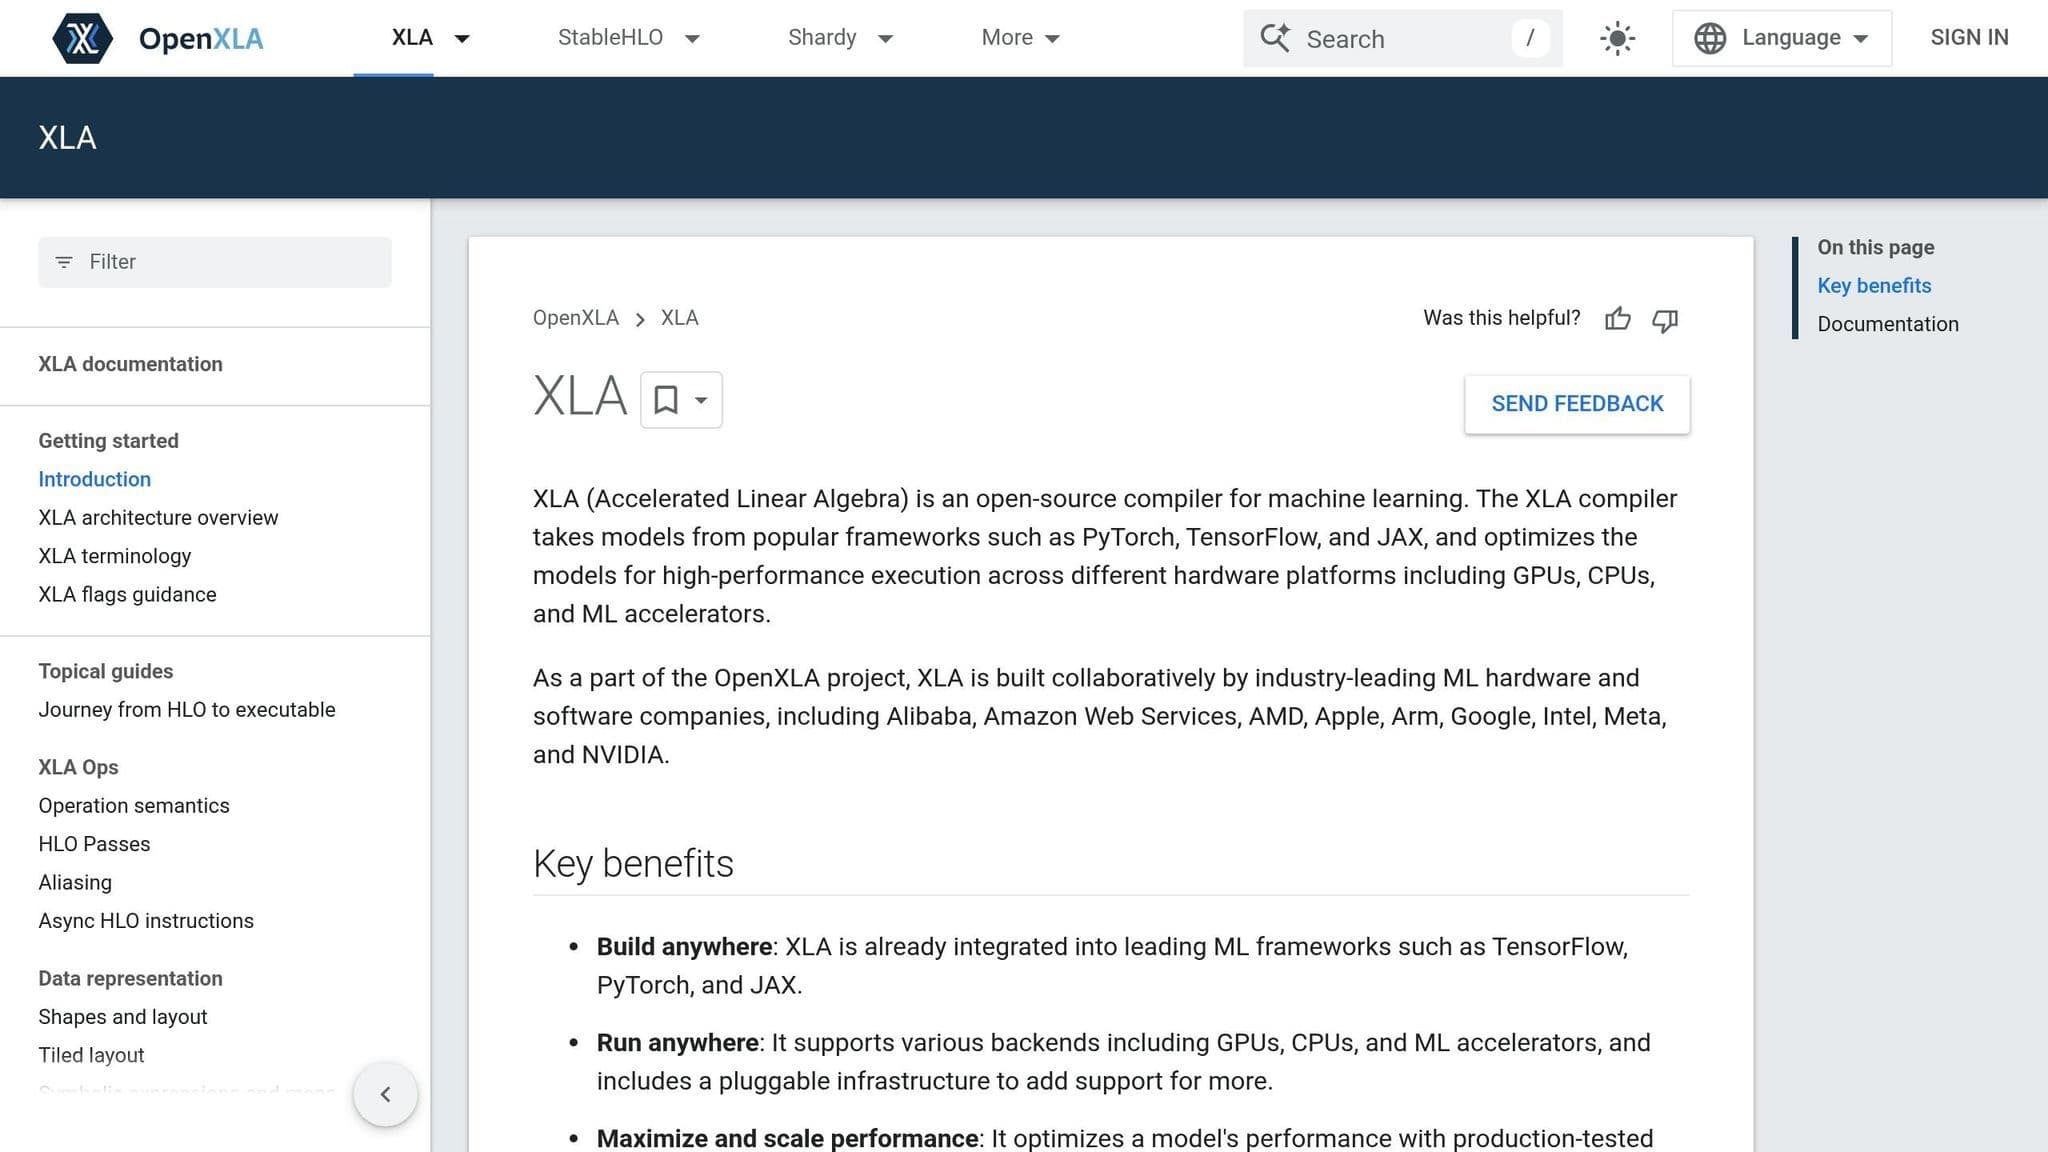
XLA (Accelerated Linear Algebra) is used by JAX and is also available through PyTorch/XLA. It treats common patterns like attention as special cases and supports JIT-based lowering across TPUs, GPUs, and CPUs.
Apache TVM goes in a different direction. Instead of leaning on hand-written fusion rules, AutoTVM uses an ML-based cost model to search for the best kernel setup for a given device. That can pay off in a big way. Apple's Core ML team found AutoTVM to be nearly 30% faster than hand-designed optimizations on M1 chips.
MLIR (Multi-Level Intermediate Representation) sits one layer below both. It uses a dialect-based IR that lowers models step by step into hardware code, with each dialect applying its own transformation passes. Put simply, MLIR is an infrastructure layer for progressive lowering, not a standalone optimizer.
The same ideas can look pretty different once you get to deployment. At that point, portability, latency, and hardware lock-in tend to matter more.
ONNX Runtime, TensorRT, and Glow in Deployment Workflows

In production, compiler stacks tend to focus on inference speed and portability. ONNX Runtime leans into portability and broad hardware support, so the same ONNX model can run on CPUs, GPUs, and edge devices for local inference.
TensorRT takes a more hardware-specific route. It builds an ahead-of-time inference engine for NVIDIA GPUs and applies precision calibration to push throughput on deployed inference engines.
Glow, built at Meta, separates graph optimization from code generation. That split makes it easier to target new hardware backends without having to redo the optimization passes.
| Stack | Mode | Primary Target | Main Method |
|---|---|---|---|
| XLA | JIT | TPU, GPU, CPU | Pattern-matching, fusion |
| Apache TVM | Adaptive/Search-based | CPU, GPU, ARM, WASM | ML-based cost modeling (AutoTVM) |
| MLIR | Framework/IR | Multi-backend | Dialect-based progressive lowering |
| ONNX Runtime | Runtime/Interpreter | Multi-platform | Portability, broad hardware coverage |
| TensorRT | Ahead-of-Time (AOT) | NVIDIA GPUs | AOT engine, precision calibration |
| Glow | AOT | CPU, accelerators | Separated graph opt + code gen |
A Practical Workflow for Local AI Optimization and Key Takeaways
Step-by-Step Optimization Workflow for Local CPUs
Once your compiler passes and instruction-set options are set, follow a simple sequence: profile, optimize, compile, validate.
Start with the bottleneck. Measure it before you touch anything. Use bench.py or the PyTorch Profiler to check latency and Model FLOPs Utilization (MFU). For inference workloads, keep your eyes on latency and throughput first.
After you have a baseline, export or trace the model into an intermediate representation like ONNX. Then apply graph optimizations to cut launch overhead and reduce memory traffic. From there, use torch.compile() to generate faster kernels. When graph overhead starts to shrink, instruction-set choice becomes the next big lever.
For precision, use BF16 on CPUs that support it. Drop back to FP32 when output quality matters more than speed. Use INT8 only when quantization is acceptable. And after every change, run the benchmark again. That's the only way to know whether the gain shows up in practice or just looks good on paper.
The table below shows the main stages, the usual tools, and the metrics worth tracking:
| Optimization Stage | Typical Tools | Primary Metrics |
|---|---|---|
| Baseline Profiling | bench.py, PyTorch Profiler | Latency (ms), MFU (%) |
| IR & Graph Optimization | torch.compile, ONNX | Dispatch Latency, Graph Complexity |
| Precision & Instruction-Set | BF16, FP32, INT8 | Throughput (req/s), Accuracy Loss |
| Validation | Accuracy checks, throughput stress tests | Tokens/sec, ms/token |
Only keep changes that help latency, memory use, and accuracy at the same time.
Why Compiler Optimization Matters for Privacy-Focused AI Use
Running inference locally keeps data on-device, which matters when you're working with sensitive documents, proprietary code, or personal data. Local inference keeps sensitive data on-device. And when local execution gets faster, you get better performance without giving up privacy.
Conclusion: Optimizations That Deliver the Biggest Gains
The methods that tend to move performance the most are operator fusion, cache-friendly memory layout, SIMD, low-precision execution, and picking a compiler stack that fits the deployment target. In early 2025, applying KV caching, fused kernels, and CUDA graphs to a NanoGPT architecture pushed inference throughput from 580 tokens/sec to over 14,000 tokens/sec.
The safest workflow is simple: profile first, change one stage at a time, and validate latency, memory use, and output quality after each pass.
FAQs
Which compiler optimization should I try first?
Start with torch.compile if you want a fast win on speed. It uses JIT compilation to fuse operations and cut overhead, and it often delivers a 30%–40% speedup. In NanoGPT, you can turn it on with the --compile=True flag.
From there, mixed precision training can push performance further while using less memory. If you're tuning for specific hardware like H100 GPUs, custom kernels such as FP8 matrix operations give you more control over how the workload runs.
How do I know if BF16 or INT8 is safe for my model?
It depends on your hardware and on how much accuracy your use case can give up. Start by checking whether your CPU, GPU, or accelerator supports the instruction sets you need. For example, INT8 on x86 gets a big boost from Intel DL Boost and VNNI, while GPUs usually need Tensor Core support.
NanoGPT can automatically pick the best precision on supported hardware. Even so, you should still test the model yourself to make sure BF16 or INT8 keeps the accuracy your application needs.
How do I choose the right compiler stack for my hardware?
Start by matching the compiler stack to your processor’s strengths and bottlenecks: Intel x86 for AVX-512 and Deep Learning Boost, ARM for NEON and SVE, and RISC-V for custom vector or tensor extensions.
Then line it up with the workload too. In setups like NanoGPT, newer JIT tools such as torch.compile can tune GPU kernels. On top of that, precision control, operator fusion, CUDA graphs, and specialized attention kernels can all help improve inference performance.