Custom Dashboards for AI Models: Best Practices
When managing AI models, raw data like API calls or token usage can feel overwhelming without proper context. Dashboards help transform this data into actionable insights by focusing on key metrics such as engagement, efficiency, and costs. Companies using dashboards to monitor AI are 3x more likely to benefit from Generative AI and often discover they're utilizing 3x more AI than they initially tracked.
Key takeaways:
- Start small: Focus on 5–7 metrics like daily active usage, cost per workflow, and token efficiency to avoid data overload.
- Engagement metrics: Monitor user interaction with AI tools, including daily active usage and intent resolution rates (IRR).
- Efficiency metrics: Track token usage, latency, and error rates to optimize costs and performance.
- Cost control: Use tools like NanoGPT's pay-as-you-go model to monitor spending in real-time and set alerts for budget thresholds.
- Predictive analytics: Use historical data to forecast costs, plan capacity, and detect anomalies before they impact users.
NanoGPT dashboards offer centralized tracking across 867 models, ensuring privacy with local data storage and encryption options. By designing clear, user-friendly dashboards with effective visualizations, you can make better decisions, reduce costs, and improve AI performance.
"Dashboards should simplify data, highlight trends, and prompt actionable steps - not just display numbers."
How to Build Great Dashboards (5 Principles)
sbb-itb-903b5f2
Key Metrics to Track in AI Model Dashboards
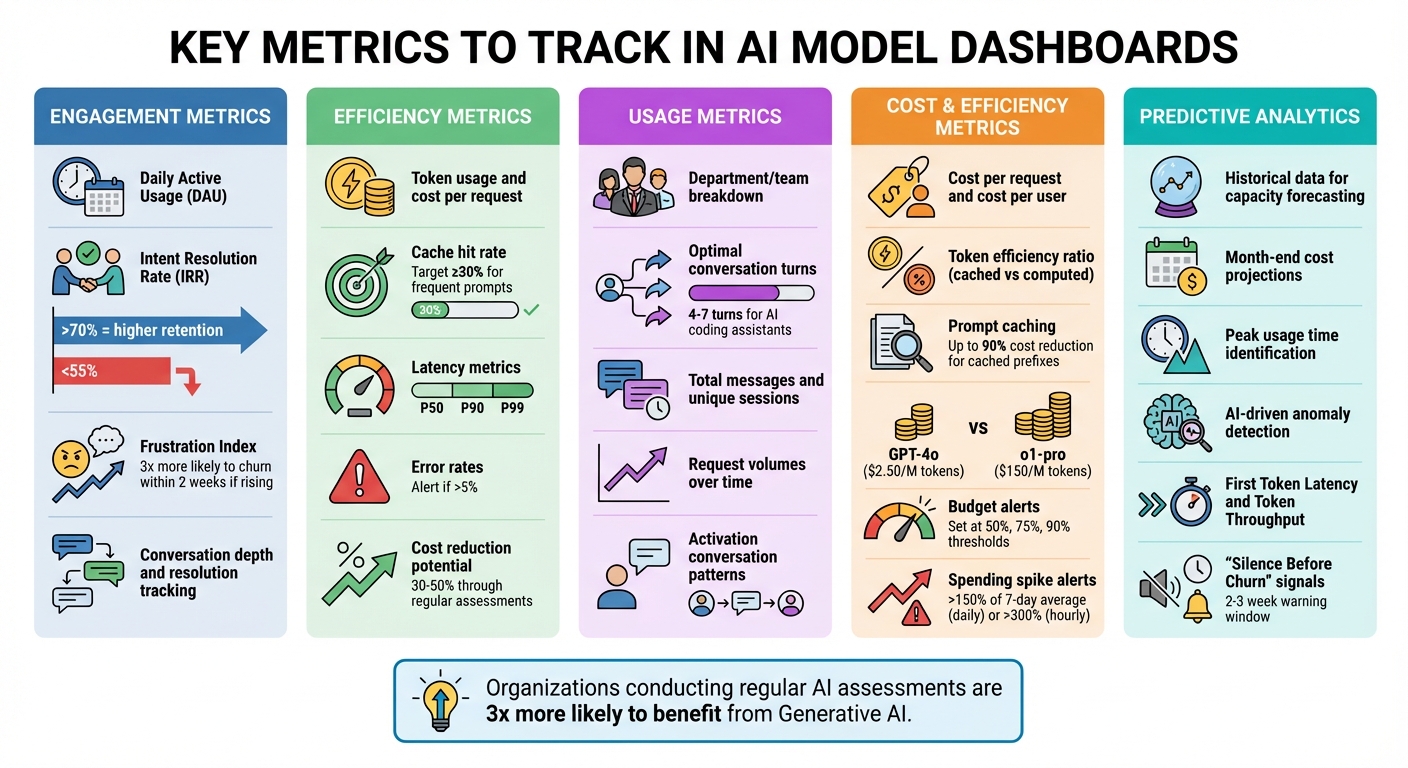
Key Metrics to Track in AI Model Dashboards: A Complete Guide
Tracking the right metrics can turn raw AI data into meaningful insights that drive decisions. Here’s a breakdown of the key metrics to focus on.
Engagement Metrics
Understanding how users interact with your AI tools starts with engagement metrics. Metrics like daily active usage (DAU), session frequency, and adoption rates (broken down by department or team) reveal who’s using the system and how often they engage.
Instead of just looking at raw usage numbers, focus on the Intent Resolution Rate (IRR) - the percentage of interactions where the AI successfully resolves a user’s issue. This metric is closely tied to revenue and retention. AI systems with an IRR above 70% tend to retain more users after 30 days compared to those with an IRR below 55%. Additionally, analyzing conversation depth - whether interactions end in resolution or abandonment - offers deeper insights into user satisfaction.
Pay attention to friction signals too. The Frustration Index highlights issues in the interaction flow by tracking behaviors like repeated messages, follow-ups after long responses, or frequent clarification requests. For instance, users with a rising Frustration Index over two sessions are three times more likely to stop using the system within two weeks.
"The teams winning at AI-native products in 2026 aren't the ones with the best models. They're the ones who actually understand what's happening in their conversations." - Agnost AI
Efficiency Metrics
Efficiency metrics help you balance performance and costs. Start with token usage and cost per request. Tools like NanoGPT simplify cost tracking by showing token consumption and spending in real-time. Aim for a cache hit rate of at least 30% for frequently used prompts to improve token efficiency. Keep an eye on latency metrics (P50, P90, P99) and error rates - spikes in error rates above 5% or a doubling of latency from the baseline warrant immediate action.
Predictive analytics can take these metrics further by using historical patterns to forecast future needs. For example, analyzing past spending trends can help you predict month-end costs and plan capacity to avoid interruptions. Regular assessments of AI systems can also help reduce API costs by 30% to 50%.
Usage Metrics
Breaking down usage by department, team, or role can expose adoption gaps and areas for improvement. Successful interactions often involve 4 to 7 conversational turns for AI coding assistants. Identifying activation conversations - specific patterns linked to long-term retention - can guide onboarding strategies. Monitoring total messages, unique sessions, and request volumes over time can also reveal important trends.
Cost and Efficiency Metrics
Aligning costs with usage ensures AI investments deliver value. Metrics like cost per request and cost per user directly connect AI spending to business outcomes. With NanoGPT’s pay-as-you-go model, it’s easy to track expenses and compare costs across features, such as chat assistance versus document analysis. For B2B applications, tagging API calls with customer IDs can calculate ROI and margins for each client.
Token efficiency - the ratio of cached to computed tokens - is another critical metric. Prompt caching can cut input costs by up to 90% for cached prefixes. Additionally, reviewing model usage ensures high-cost models are reserved for tasks requiring advanced reasoning. For example, GPT-4o costs $2.50 per million input tokens, while o1-pro costs $150.
Set budget alerts at 50%, 75%, and 90% of your monthly budget. Spending spikes - daily increases over 150% of the 7-day average or hourly jumps exceeding 300% - signal inefficiencies that need immediate attention.
Predictive Analytics
Historical data provides a roadmap for future planning. By analyzing past request volumes, you can forecast capacity needs and avoid service disruptions. Month-end cost projections also help with budget management. Identifying peak usage times allows for better resource allocation, such as adjusting caching strategies. Tracking frequently used models can guide decisions on selecting cost-effective options for specific tasks.
AI-driven anomaly detection adds another layer of insight by flagging significant changes in usage metrics in real time. Performance metrics like First Token Latency and Token Throughput help identify bottlenecks before users are affected. Finally, watch for signs of "Silence Before Churn" - users sending shorter messages, reducing follow-ups, or narrowing their topics. This behavior provides a critical 2–3 week window to re-engage users before they leave.
These metrics lay the groundwork for designing dashboards that integrate data from multiple sources, ensuring a comprehensive view of AI performance and user behavior.
Integrating Data Sources for NanoGPT Dashboards
Creating a custom dashboard begins with connecting to the right data sources. NanoGPT's API offers tools for tracking usage, costs, and performance, all while ensuring your data stays under your control.
Accessing Usage Data via APIs
NanoGPT provides real-time consumption data through its /api/subscription/v1/usage endpoint, which returns information in a straightforward JSON format. To authenticate, you'll need an API key, which can be passed in the HTTP headers using either Authorization: Bearer <api_key> or x-api-key: <api_key>. For flexibility, you can generate up to 10 API keys, making it easier to manage integrations for different environments, like development versus production.
The API delivers key metrics like daily.used, monthly.used, and resetAt timestamps, which are ideal for building progress indicators or setting up alerts for usage limits. Keep in mind that these counters reset globally at 00:00 UTC, so your dashboard should account for this when analyzing daily trends. For more granular data, the usage object within /v1/responses provides token counts separated into input, output, and reasoning categories.
NanoGPT enforces a global rate limit of 25 requests per second, so plan your API calls carefully. Instead of repeatedly querying the same data, consider storing API responses in a local database, such as SQLite in WAL mode. This approach not only helps you stay within rate limits but also speeds up dashboard performance. For additional information, like model metadata and pricing, use the GET /api/personalized/v1/models?detailed=true endpoint, which provides up-to-date details as NanoGPT's offerings evolve.
If your dashboard tracks generated images, make sure to download and store them immediately. NanoGPT deletes files after 24 hours, and signed URLs expire within about an hour. For tasks that take longer, such as video generation, implement polling mechanisms using endpoints like /api/generate-video/status to avoid timeouts.
Finally, ensure that all these integrations follow NanoGPT's strict local privacy guidelines.
Ensuring Local Data Privacy
Once your API connections are in place, it's critical to implement data privacy measures that align with NanoGPT's security-first approach.
NanoGPT stores data locally by default, and your dashboard should follow suit when handling API data. If you use the store: true parameter to save responses on NanoGPT's servers, make sure to include an x-encryption-key or x-encryption-passphrase generated on the client side. This ensures that NanoGPT itself cannot access the stored content.
For situations requiring zero data retention, set retention_days to 0 in your API requests. If you're dealing with highly sensitive information, consider using models backed by a Trusted Execution Environment (TEE). You can verify the security of these models by fetching attestation reports through GET /api/v1/tee/attestation.
For dashboards handling high traffic - say, 10,000 daily visitors - a local SQLite database typically consumes around 900 MB of storage per year. This setup aligns perfectly with NanoGPT's pay-as-you-go structure, giving you control over both your data and costs while maintaining privacy.
Designing User-Friendly Dashboards
Once your data sources are connected, the next step is turning raw data into dashboards that people will actually use. As ChartGen puts it, "A simple dashboard that gets opened daily beats a sophisticated one that gets ignored". The goal is to focus on clarity and usability, not to overwhelm with every possible metric.
A helpful tip is to follow the "5-Second Rule": users should be able to spot the most important information within five seconds of looking at your dashboard. This means keeping core metrics front and center. Research shows that organizations conducting regular AI system assessments are three times more likely to see high returns from Generative AI. A well-designed, focused dashboard can make those assessments even more impactful.
Once you've narrowed down the key metrics, the next step is choosing the right charts to present them effectively.
Choosing Effective Visualizations
Selecting the right type of chart can make all the difference between clear insights and confusion. For example:
- Line charts are ideal for showing trends over time, like tracking API latency or conversation volume.
- Bar charts work well for comparing data, such as usage levels across different AI models like ChatGPT, Deepseek, or Gemini.
- Gauges provide real-time status updates, perfect for monitoring system health or API limits.
For more specific needs, consider specialized visualizations:
- Sankey diagrams highlight user flows, helping you identify where users drop off in multi-turn interactions.
- Heatmaps show retention trends by signup cohort, revealing which user groups stay engaged.
- Scatter plots are great for spotting outliers, like unusually high response times tied to certain token usage levels.
Stick to familiar chart types whenever possible to keep things intuitive. Use color wisely - red for errors or alerts, green for normal operations - and add labels or icons to make the data accessible to everyone.
By choosing visualizations that align with your analytics goals, your dashboard becomes more than just a data display - it becomes a tool for driving decisions. Once the visualizations are in place, the layout ensures users can interpret the data effortlessly.
Organizing Dashboard Layouts
The layout of your dashboard is just as important as the charts themselves. People naturally scan dashboards in an F-pattern, starting at the top-left corner. Place your most critical KPI there - on a NanoGPT dashboard, this might be total monthly spend or daily API request volume.
Group related metrics together to make comparisons easier. For instance, placing model usage metrics next to associated costs helps users quickly see how the two are connected. Use a clean grid layout with plenty of white space to avoid visual clutter.
Limit your dashboard to 5–7 main elements to keep it focused. If more detail is needed, use progressive disclosure: show high-level summaries first, with options to drill down for more granular data. Fit all essential insights onto a single screen to make the dashboard easy to digest. Additionally, make sure the data refresh rate matches the decision-making cycles of your team.
"Every chart should suggest an action. If it doesn't lead to a decision, question whether it belongs." – ChartGen
This advice is especially relevant for dashboards tracking NanoGPT models and usage patterns. Each chart should answer a specific question, like "Which models are the most cost-effective?" or "Are we nearing our daily usage limits?" When every element has a clear purpose, your dashboard evolves from a simple data display into a tool that drives smarter, faster decisions.
Optimizing Dashboards for Actionable Insights
Taking your dashboard from a simple reporting tool to a platform that drives meaningful decisions is a game-changer. By tapping into NanoGPT's real-time data, you can implement strategies that don’t just display metrics but actively guide your team toward actionable steps.
Instead of focusing solely on raw data like API call volumes or token counts, reframe your NanoGPT dashboard as a decision-making tool. For example, rather than just showing monthly spending on various models, the dashboard could flag when costs exceed a set threshold and suggest ways to cut inefficiencies.
Organize your data into four key layers: Reality (raw numbers), Interpretation (segmented data), Meaning (business impact), and Action (triggers for intervention). This layered approach ensures your team understands not just what’s happening but what to do about it.
"Effective dashboards should show key metrics and the impact of automation decisions, so teams can guide optimization instead of just reporting activity".
This approach is especially critical because organizations that regularly assess their AI systems are three times more likely to extract high value from Generative AI. The next step? Turning insights into immediate action with real-time alerts.
Using Alerts and Notifications
Real-time alerts are your first line of defense against escalating issues. But to avoid overwhelming your team, notifications should be limited to situations requiring immediate action. For instance, focus on key conditions like error rates exceeding 1%, latency surpassing 1 second at the 90th percentile, or NanoGPT credits dropping below 20% of your allocation.
To make alerts more effective, use tiered thresholds. For example, set a "Watch" level for a 10% deviation to raise awareness and an "Action" level for a 20% deviation that triggers specific response plans. If daily API requests for image generation spike by 20%, the alert should include details like which model (e.g., Flux Pro, DALL-E, or Stable Diffusion) caused the increase. This way, your team knows exactly where to focus.
Integrate these alerts with tools your team already uses, such as Slack, PagerDuty, or email. For financial metrics, like spending exceeding 10–20% above the previous month’s baseline, notifications should include actionable suggestions or links to relevant procedures. Periodically test your alerts by simulating errors to ensure the system works as expected.
| Alert Category | Metric Example | Recommended Threshold |
|---|---|---|
| Availability | Agent Status | Trigger immediately on "Error" or "Stopped" |
| Performance | Endpoint Latency | P90 duration > 1 second |
| Quality | Error Rate | > 1% of total requests |
| Economics | Credit Usage | < 20% of monthly allocation remaining |
| Activity Spike | Daily API Calls | Significant deviation from historical average |
While alerts help with immediate interventions, feedback loops ensure your dashboard stays relevant and effective.
Incorporating Feedback Loops
Dashboards should adapt based on how users interact with them. Add direct feedback tools like thumbs-up/thumbs-down buttons or 1–5 quality ratings next to AI outputs. This allows users to quickly highlight what’s working and what isn’t.
With 79% of organizations already using AI agents - but many lacking proper failure tracking - structured feedback becomes even more critical. Let users leave detailed comments on traces and spans to help identify performance issues. Track behavioral data, such as session IDs and chat inputs, to understand which features are most engaging.
Consider adding an LLM-powered assistant to your dashboard. This feature would let users request new charts or summaries in plain language, making the tool accessible for non-technical team members. Use this feedback to fine-tune prompts and retrain models every 30 to 90 days to prevent performance degradation.
Lastly, maintain a decision log that records what the dashboard flagged, the actions taken, and the outcomes. This creates a learning loop, helping your team continuously refine which metrics matter most. By incorporating user feedback and refining processes, your dashboard will stay aligned with both business goals and NanoGPT's focus on delivering actionable insights.
Conclusion and Next Steps
A custom dashboard transforms AI data into a practical tool for smarter decision-making. By focusing on key metrics, integrating secure data sources, and ensuring a clear design, you can create a system that helps your team cut costs and improve performance.
NanoGPT makes this easier by consolidating multiple AI models under one API. With access to 867 models across text, image, video, and audio, you can manage various model types through a single interface. Use the /api/personalized/v1/models endpoint to filter models and the /api/v1/tee/attestation endpoint to ensure secure data handling for sensitive tasks.
To get started, pull detailed model lists using the ?detailed=true parameter to view live pricing and capabilities. Track your spending with /api/subscription/v1/usage, and for high-latency tasks such as video generation, implement polling with runId and modelSlug.
NanoGPT offers risk-free testing with deposits as low as $1.00. Its OpenAI-compatible endpoints work seamlessly with low-code platforms like Retool or n8n, enabling quick dashboard prototypes. Enhance user engagement by activating the stream: True parameter for real-time text generation in chat completions.
Organizations that regularly evaluate their AI tools are three times more likely to achieve high returns from Generative AI. Your dashboard should evolve based on team feedback, prioritizing the metrics that align with your business goals. With NanoGPT's transparent pricing and privacy-focused features, you have the tools to build a dashboard that maximizes AI's potential. Keep refining it with user input and performance data to ensure it stays effective and aligned with your objectives.
FAQs
What’s the fastest way to pick my first 5–7 AI dashboard metrics?
To get started with your first 5–7 AI dashboard metrics, zero in on key indicators that provide a clear picture of system performance, user activity, and overall business impact. Good starting points include metrics like response times, success rates, resource consumption, and adoption rates. Be sure to define the purpose of your dashboard, align metrics with your objectives, and focus on those that deliver practical insights. This approach keeps your setup straightforward and avoids overcomplicating things.
How do I securely connect NanoGPT usage and model data to my dashboard?
To integrate NanoGPT data with your dashboard safely, you’ll need to use NanoGPT's API with proper security measures in place.
Start by generating an API key, which acts as your unique access credential. When making requests, include this key in the request header using the format: Authorization: Bearer YOUR_API_KEY. This ensures that only authorized users can access the data.
Always transmit data over HTTPS to protect it during transfer. Additionally, store your API keys in safe locations, such as environment variables, to keep them out of reach from potential security breaches.
It’s also a good idea to regularly monitor your API usage. Set limits and track activity to quickly detect and prevent any unauthorized access or accidental data exposure. These steps will help maintain the integrity and security of your connection.
What alerts should I set first to avoid cost spikes and outages?
To keep track of your spending, set up alerts based on your budget's timeframe - daily, weekly, or monthly. Daily alerts are perfect for applications with high activity, as they provide frequent updates. On the other hand, weekly or monthly alerts are better suited for budgets that are either fixed or gradually increasing. These alerts help you stay on top of your expenses and prevent sudden cost surges or disruptions in service.