
Energy Efficiency in AI Pipelines: Research Insights
If I had to boil this research down to one point, it’s this: measure each pipeline stage, cut token waste, and pick hardware based on the job. That’s where a lot of energy savings show up.
From the studies covered here, I’d focus on four things first:
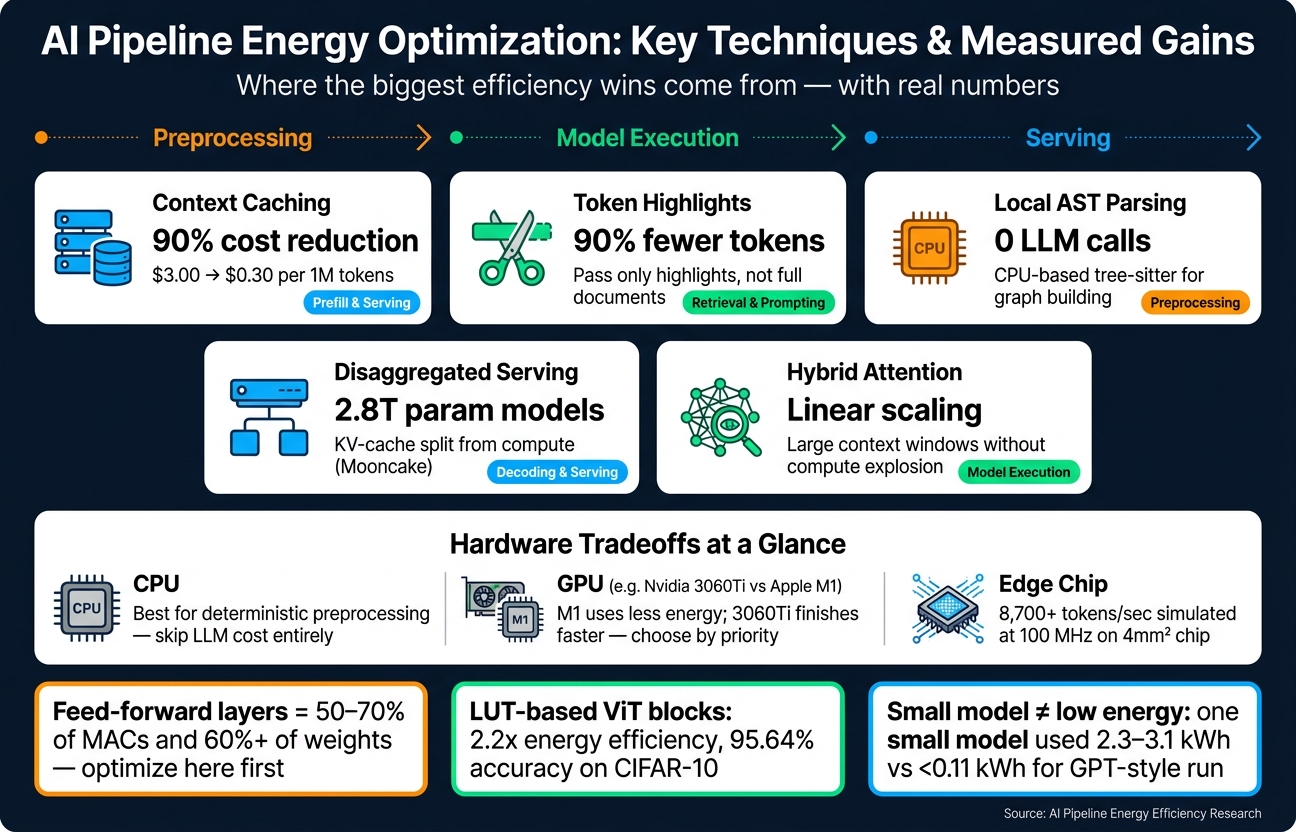
- Feed-forward layers are still the main compute hotspot in transformer systems, often driving 50%–70% of MACs and holding over 60% of weights
- Token reduction can have a huge effect; one example cut prompt input by 90%
- Context caching can slash repeated-input cost from $3.00 to $0.30 per 1 million tokens
- Hardware tradeoffs are not simple; a lower-energy device may use fewer joules but still finish slower
If I were building or reviewing an AI workflow, I’d start with these checks:
- Profile preprocessing, model execution, and serving separately
- Track joules per generated token, not just total power draw
- Remove work that does not need an LLM, like local parsing for structured tasks
- Test quantized models and watch feed-forward blocks first
- Match CPUs, GPUs, and edge chips to request volume, latency needs, and context size
Here’s the short version in one view:
| Area | What the research points to | What I’d do first |
|---|---|---|
| Model internals | MLP/feed-forward blocks use a big share of compute | Start profiling and compression there |
| Inputs | Long prompts and full-document RAG waste tokens | Pass only highlights or trimmed context |
| Serving | Decoding can be memory-bound | Use caching and test serving layout |
| Preprocessing | Some tasks do not need an LLM at all | Move structured steps to local CPU tools |
| Hardware | Lowest energy and lowest latency are often different | Choose for the workload, not by default |
In plain English: the main wins come less from one magic model tweak and more from cutting waste across the whole pipeline. The rest of the article backs that up with stage-level measurement, bottleneck data, and deployment choices you can use right away.
How Studies Measure Energy Across the Pipeline
To compare systems fairly, researchers don’t just look at one power number and call it a day. They trace energy across the full pipeline, stage by stage. In practice, that means combining software tracing, hardware telemetry, and layer-by-layer profiling to see where the energy actually goes.
Per-Stage Profiling: Preprocessing, Model Execution, and Serving
Studies usually split the pipeline into three parts: preprocessing, model execution, and serving. From there, they profile Q, K, V projections, attention, concatenation, and feed-forward blocks to find energy hotspots per token.
That kind of breakdown matters. It shows which sublayers cost the most, instead of lumping everything into one average and hiding the problem areas.
Hardware-Level Metrics Used in Recent Experiments
At the hardware level, researchers often report:
- Energy
- Joules per inference
- Latency
- Throughput
- Memory use
- Hardware utilization
They also track chip-specific limits, such as FPGA LUT usage and ASIC area-delay product.
One common software tool is CodeCarbon, a Python library that logs training and inference energy inside existing Python codebases. That helps teams measure energy without rebuilding their whole workflow around a new tool.
There’s a catch, though. The lowest-energy device can also be the slowest. So a system may save power but still hurt response time.
Researchers now report joules per generated token more often because it normalizes sequence length and batch size. That makes it easier to compare systems on equal footing and spot the bottlenecks discussed in the next section.
sbb-itb-903b5f2
Key Bottlenecks and the Most Effective Optimization Methods
AI Pipeline Energy Optimization: Key Techniques & Measured Gains
Where Energy Gets Wasted: Vision Encoders, Token Expansion, and Memory-Bound Decoding
Stage-by-stage profiling keeps pointing to the same three trouble spots: vision encoders, token growth, and memory-bound decoding. Vision encoders often eat up a big share of early compute and memory traffic. That matters fast at the high end. At 2.8 trillion parameters and a 1-million-token context window, Kimi K3 requires disaggregated serving.
Token growth is another clear drain. If you pass full documents into RAG, you pay for a lot of input that the model may not need. Pulling out highlights instead cuts input tokens by 90%.
Memory-bound decoding is the third bottleneck. In plain terms, the system can spend more time moving data than doing useful math. That’s why serving design matters so much once model size and context length start to climb.
Optimization Methods With Measured Gains
The good news is that the strongest fixes line up neatly with those bottlenecks. Automatic context caching cuts cached-input cost from $3.00 to $0.30 per million tokens. That’s a huge drop for repeated prompts and long sessions.
For extreme-scale inference, KV-cache-centric disaggregated serving setups such as Mooncake split cache management from compute. That makes memory-bound decoding much more workable. On the model side, hybrid linear attention helps large context windows scale without compute growing at the same rate.
Some of the best savings come from not using the model at all when you don’t have to. For structured tasks like code intelligence, local CPU-based AST parsing with tools like tree-sitter removes all LLM calls during graph building.
Here are the clearest techniques at a glance:
| Technique | Reported Impact | Pipeline Stage |
|---|---|---|
| Context caching | 90% cost reduction for cached inputs | Prefill and serving |
| Token highlights | 90% reduction in tokens passed to models | Retrieval and prompting |
| Local AST parsing | No LLM calls during graph building | Preprocessing |
| Disaggregated serving | Practical inference for 2.8 trillion-parameter models | Decoding and serving |
| Hybrid attention | Improved scaling efficiency for very large context windows | Model execution |
When CPUs, GPUs, and Edge Devices Are the Better Energy Choice
The best hardware depends on the job. The tradeoff is simple: energy per inference on one side, latency and scale on the other.
Frontier-class models with extreme parameter counts still call for heavy GPU infrastructure. That’s the price of running at that size. CPUs, by contrast, make a lot of sense for deterministic preprocessing. If local parsing can do the work, you skip LLM cost entirely.
Edge hardware is also becoming a serious option for narrow, high-throughput workloads. Moonshot AI showed a 4-square-millimeter chip design that reached more than 8,700 tokens per second in simulation at 100 MHz. That kind of result won’t fit every use case, but it shows where efficient inference can go when the task is tightly scoped.
What These Findings Mean for Developers Building AI Workflows
Balancing Energy, Latency, Cost, and Privacy From the Start
Once you spot the bottlenecks, the next step is deployment. And that’s where things get practical fast.
Those bottlenecks don’t stay abstract for long. They turn into direct choices about model size, precision, and serving setup. In many cases, those three decisions shape most of the energy bill. So inference efficiency isn’t just a back-end detail anymore. It becomes part of day-to-day operations.
At the model level, precision and sparsity are the fastest levers to pull. A smaller or quantized model variant can cut memory pressure and compute overhead. For example, an 8-bit quantized version with SmoothQuant can help reduce both. If you’re deciding where to spend optimization time, start with feed-forward blocks. That’s usually where quantization and pruning can do the most work, including for compressed or weightless variants built for low-power settings.
How Platforms Like NanoGPT Fit This Research
The same idea carries over to the platform level: don’t bring in heavy infrastructure unless the workload calls for it.
Match serving capacity to actual workload volume. If jobs are low-volume or intermittent, always-on capacity is hard to justify. It’s a bit like keeping a full warehouse staff on the clock to ship one package every few hours. The math just doesn’t work.
NanoGPT fits this approach with pay-as-you-go access to text and image models and no subscription. Local device storage also helps with privacy-sensitive workflows. A sensible setup is to handle lightweight tasks locally, then save heavier multimodal runs for the jobs that are worth the extra cost.
Conclusion: Key Research Insights to Apply Now
MLP layers are still the main compute hotspot in common transformer architectures. So if you're deciding where to spend time on optimization, start there.
But here's the catch: a bottleneck only matters after you measure it. Measurement comes before optimization. Per-stage tracking with tools like CodeCarbon shows where energy is actually going. And the results can be a little surprising. One small model used 2.3 to 3.1 kWh during training, while a small GPT-style run on the same hardware used less than 0.11 kWh. In plain English, small model does not automatically mean low energy use.
Hardware matters just as much as model design. An Apple M1 used less energy than an Nvidia 3060Ti, but the 3060Ti finished the job much faster. That trade-off matters. If latency is the priority, the faster GPU may be the better fit. If energy use matters more, the lower-power option may make more sense.
Model design can also move the needle in a big way. Replacing 55% of Vision Transformer multiplications with LUT-based blocks improved energy efficiency by 2.2x while keeping 95.64% accuracy on CIFAR-10. That's a strong signal that architecture changes can cut energy use without wrecking model performance.
The studies point to a few moves you can apply right away:
- Profile each stage with CodeCarbon to find the real bottlenecks.
- Cut visual and prompt overhead, then test quantized variants to reduce memory and compute load.
- Match hardware to request patterns - use high-performance GPUs for low-latency work, and edge chips for batch jobs.
The core takeaway is simple: measure stage by stage, cut input waste, and match hardware to the workload.
FAQs
How can I measure joules per token in my pipeline?
Measure total energy use during inference, then divide it by the total number of tokens generated. In a Python codebase, tools like CodeCarbon can help log power usage.
For cleaner results, stick to the same hardware setup each time. And if you're working with reasoning-heavy models, count internal thinking tokens too by using the same 4x to 10x token multiplier. That helps account for hidden energy use happening behind the scenes.
When should I use a CPU, GPU, or edge chip?
Choose hardware based on what the task actually needs:
- CPU works well for sequential tasks like natural language processing and standard text generation
- GPU is better for heavy matrix operations in image, video, and multimodal processing
- Edge chips/NPUs handle local processing, which helps cut wireless data transmission
A simple way to think about it: use edge hardware for routine on-site data, then send only high-priority tasks to the cloud.
What work can I remove from the LLM entirely?
You can cut some operations out at the model-design level.
Work on Quasi-Weightless Transformers shows that MLP layers can be swapped for differentiable weightless neural network layers. Instead of leaning on standard multiplications, these layers use lookup operations.
Research on FLARE points to another place where models can trim the fat. It shows that extra operations in learned relative position encodings inside the attention block can be removed.
The result is simpler computation, lower energy use, and less silicon area, while performance stays in line with the original setup.