Key Metrics for Predictive Feature Usage Analytics
If I want predictive feature analytics to help me make decisions, I track four things first: adoption, repeat use, model performance, and business results. That keeps me focused on what users do inside a feature, not on noisy top-line product activity.
Here’s the short version:
- Adoption: I check activation rate, first-use rate, time to first meaningful action, and exposure rate
- Repeat use: I watch repeat usage, usage frequency, cohort retention, DAU/MAU, and segment-level depth
- Model performance: I review precision, recall, AUC, calibration, and error by segment
- Business results: I measure NRR, Expansion MRR, churn signals, and time from signal to action
A few numbers stand out. A 30% drop from baseline can point to churn risk. DAU/MAU below 20% can show weak habit. Acting within 24 hours of an engagement drop can drive a 62% save rate, versus 28% after 7 days. And when feature breadth shrinks, that pattern can show up before 78% of involuntary churn events.
I’d keep one rule in mind: if a metric does not lead to a product, sales, or success action, I drop it. The goal is not more dashboards. The goal is better calls, made sooner.
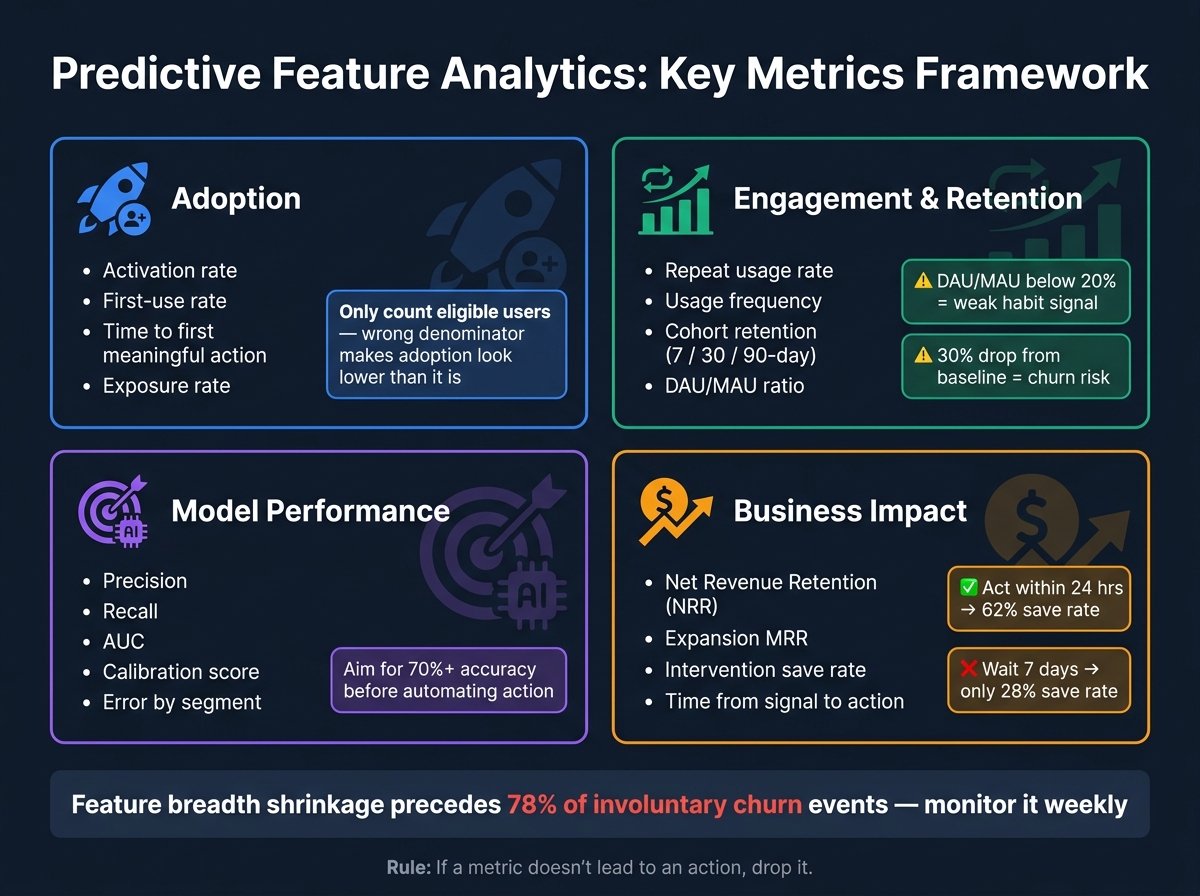
Predictive Feature Analytics: Key Metrics Framework
What Is Predictive Analytics | How Does Predictive Analytics Work | Data Analytics | Simplilearn

sbb-itb-903b5f2
Quick comparison
| Area | What I measure first | What it tells me |
|---|---|---|
| Adoption | Activation rate, first-use rate | Who started using the feature |
| Engagement depth | Repeat usage, frequency, actions per user | Who came back and built a habit |
| Retention | 7/30/90-day cohorts, DAU/MAU, baseline drops | Whether usage is sticking or fading |
| Model performance | Precision, recall, AUC, calibration | Whether the prediction can be trusted |
| Business results | NRR, Expansion MRR, save rate, response time | Whether the system changes revenue or churn |
So if I were setting this up today, I’d start small: define the feature, define the one action that means value, choose a 30-, 60-, or 90-day window, and track only the metrics tied to a next step.
Checklist: Feature adoption metrics
Adoption metrics answer one question: are users starting to use the feature? Not just noticing it in a menu or clicking past it, but putting it to work. These three metrics are the starting point.
Activation rate and first-use rate
Activation rate shows the share of users who complete the first-value action. First-use rate tracks the share who complete that first meaningful action.
Only count eligible users: people with the right plan tier, role, or permissions. If you include everyone, adoption will look lower than it is. So if your activation rate is 40%, that means 40 out of 100 eligible users completed the first-value action.
Activation is an early sign that people may keep using the feature.
Time to first meaningful action
Track the median time from first exposure to first meaningful action. Averages can blur the picture by mixing fast adopters with slow ones.
Start the clock at feature exposure, not at account sign-up. The formula is simple: timestamp of first adoption event minus timestamp of first exposure. If that gap is long, trace each step between exposure and the activation event, then remove anything that doesn’t need to be there. Interest fades fast after the first encounter, so every extra step can cost you.
Feature discovery and exposure rate
Exposure rate tells you reach, not performance. If exposure is high but adoption stays low, run a funnel analysis between discovery and value.
It also helps to segment by role and tier so you can see which adoption signals point to later use. A feature can work well for one persona and fall flat for another. When you lump all users together, that split disappears.
Once adoption is clear, measure whether users return.
Checklist: Engagement depth and retention metrics
Adoption tells you who started. Engagement depth tells you who stuck around - and whether that usage is turning into a habit or just a one-off visit.
Repeat usage, session frequency, and actions per user
Repeat usage rate helps you separate people who tested a feature once from people who now use it as part of their day-to-day work. Pair that with session frequency and actions per user, and you get a clearer view of what’s happening: are users coming back, and are they doing more than the bare minimum?
The key is simple: track repeat use, not just total activity. A big activity number can look good on the surface, but it doesn’t tell you if the feature is becoming part of the workflow.
There’s a common pattern to watch. New features often surge right after launch because people are curious. Then usage dips. That’s normal. What matters is the baseline after that spike. That post-launch baseline shows whether the feature has staying power. If frequency holds steady or starts to climb after the initial drop, that’s a good sign. Once activation is clear, look at whether users come back often enough to build a habit.
Feature retention by cohort and time window
Start the cohort clock at the activation event - the first meaningful action inside that feature - not at account signup. That gives you a cleaner read on feature retention.
Track:
- 7-day retention
- 30-day retention
- 90-day retention
- DAU/MAU below 20%
- Any 30% drop from baseline as a churn signal
These time windows help you see whether repeat usage is settling in or fading out.
Breadth of use across user segments
Aggregate engagement numbers can hide the truth. A feature can look healthy overall while a small group of power users does most of the work, and everyone else barely uses it.
Break engagement down by segment so you can see where depth is actually concentrated. Useful cuts include:
- Team size
- Acquisition source
- Device type
- Browser
- Integration status
Also watch for shrinking feature breadth. If users start using fewer modules over time, that pattern comes before 78% of involuntary churn events. Track whether usage is spreading beyond power users in the segments that matter. Broad, steady use also gives the model cleaner segment-level signals.
Checklist: Prediction quality metrics
Once you know people are using the feature, the next step is simple: is the model getting things right? Engagement metrics tell you what users do. Prediction quality metrics tell you whether the model’s judgment about that behavior is worth trusting.
Accuracy, precision, recall, and AUC
Accuracy can be misleading, especially for rare events. If an event almost never happens, a model can post high accuracy and still be poor at the one thing you care about.
For rare events, lean on precision or recall based on the cost of getting it wrong.
- Use precision when false positives are expensive. For example, if the model triggers a costly human review for a user who was never at risk, low precision wastes time and money.
- Use recall when missing the event is expensive. If the model fails to flag a high-value account that’s about to churn, the miss can hurt more than a false alarm.
- For binary predictions, treat accuracy as a basic gut check. Then choose precision or recall based on the tradeoff between false positives and false negatives.
Use AUC to compare binary models across thresholds. It helps you compare ranking performance, but it shouldn’t replace recall. Use it with recall, not instead of it.
Calibration and error by segment
Once ranking looks good, check whether the model is calibrated and steady across segments. This matters because a model can look strong in the aggregate and still stumble for certain groups.
Calibration means the model’s predicted probabilities line up with what happens in practice. A plain way to test this is to plot stated confidence against observed outcome rates. In a well-calibrated system, those numbers should track closely. If users often override high-confidence predictions, that’s a warning sign: the model sounds sure of itself, but it’s wrong.
You should also break error analysis into segments like user tenure, request complexity, use case clusters, and prediction-confidence quartile. These cuts often show weak spots that top-line metrics hide.
Metric-task fit and monitoring schedule
After checking overall accuracy and calibration, match each metric to the job it needs to do. In practice, that means mapping each prediction target to its main metric, then reviewing it every week for drift, overrides, and segment-level error.
"Product metrics need a weekly cadence, because AI features change behaviour faster than traditional software (prompt drift, model updates, input distribution shifts) and the feedback loops are shorter." - Logan Lincoln
A weekly review cadence fits product-layer metrics well. Monthly reviews are often too slow to catch prompt drift or the effects of model updates. During each review, look at whether adoption is moving, whether override rates are changing, and whether escalation patterns are getting better. Before weekly scoring, filter out automated events.
Checklist: Business impact metrics and conclusion
Conversion, retention, revenue, and cost efficiency
Once prediction quality is steady, the next step is simple: check whether the model changes behavior and makes money. Don’t track metrics just because they look nice on a dashboard. Track the ones that tie predictions to growth, retention, revenue, or cost.
Start with NRR. Then look at Expansion MRR from prediction-based upsells and any lift in trial conversion.
Also keep an eye on usage contraction and login-frequency drops. Those are early churn signals, and timing matters a lot here. Intervention within 24 hours of an engagement drop yields a 62% save rate; wait 7 days and that drops to 28%.
Actions triggered by predictions
A prediction by itself doesn’t do much. Each one needs a clear next step. One signal, one action.
If a user hits a usage limit like storage, API calls, or seats, trigger an upsell prompt. If engagement falls off a cliff, send an educational email or trigger a customer success check-in. The main operating metric here is time from signal to action. Teams should aim to respond within 48 hours. That’s where the payoff comes from.
Put these alerts right inside CRM records so sales and success teams can act in place, without jumping between tools. If an account has $1,250.00 in expansion potential, that number should show up directly in the CRM record.
Final checklist: which metrics to track first
Use this short list to decide what to track first.
| Metric Category | Start With | Why It Matters |
|---|---|---|
| Adoption | Activation rate, first-use rate | Catches early-stage drop-off before it compounds |
| Engagement depth | Usage frequency, usage depth | Shows whether the feature has real stickiness |
| Retention | Cohort retention, login-frequency drops | Leading indicator of churn risk |
| Prediction quality | Precision, recall, AUC | Aim for 70%+ accuracy before automating action |
| Business impact | Expansion MRR, intervention save rate | Ties the system to revenue outcomes; a 15% to 25% signal-to-close rate is a solid benchmark |
The practical move is to track the small set of metrics that supports one decision for one feature. Start with these five categories, cut anything your team can’t act on, and only add more detail when a decision needs it.
FAQs
Which metric should I track first?
Start by tracking total input and output tokens. This gives you a clear view of your AI workload and shows how usage changes over time.
How do I choose between precision and recall?
Choose the metric based on what you want from feature usage analytics. Precision matters when false positives are expensive, like flagging feature interactions that don’t matter. Recall matters when missing actual feature use would leave gaps in your insights.
If completeness matters more, lean toward recall. If cutting false alarms matters more, lean toward precision. If you need a middle ground, the F1-score can help balance both.
What is a good response time for churn signals?
A good response time for churn signals is within 24 hours if you want the best shot at keeping a user.
Move fast here. Prompt action can make a big difference when you're trying to save at-risk users.