How to Monitor AI Models for Errors
Monitoring AI models isn't just about tracking uptime or error codes. It's about catching subtle issues like incorrect outputs, data drift, and security risks before they harm user trust or your budget. Here's what you need to know:
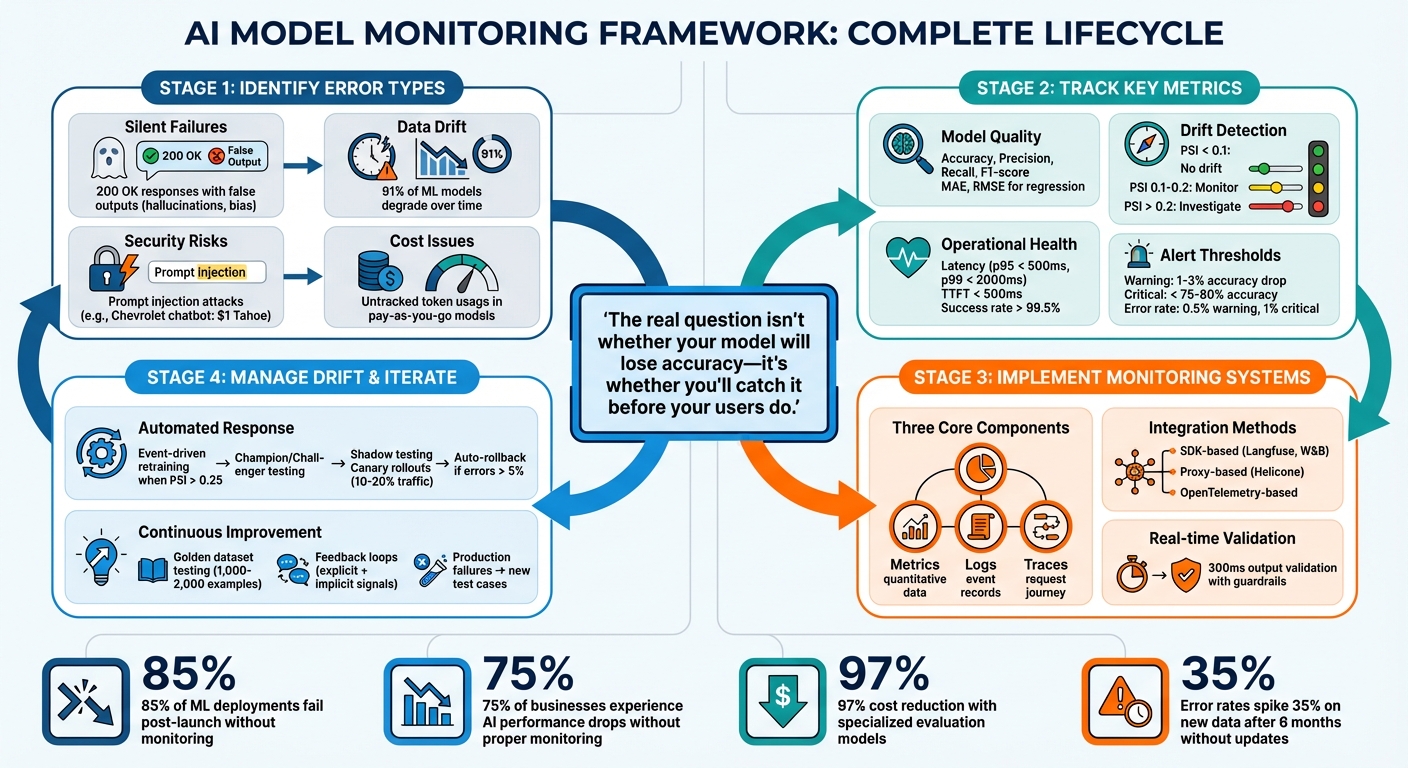
- Silent Failures: AI models can return "200 OK" responses while generating false or irrelevant outputs, like hallucinations or biased content.
- Data Drift: Models lose accuracy over time as input patterns or relationships between variables change.
- Security Risks: Prompt injection attacks can exploit vulnerabilities, leading to harmful or unintended outputs.
- Cost Management: Pay-as-you-go models like NanoGPT require careful tracking of token usage and response quality to avoid budget overruns.
To stay ahead, track metrics like accuracy, latency, data drift (using tools like PSI), and token usage. Set clear thresholds and real-time alerts to address issues promptly. Use tools like OpenTelemetry or SDK-based solutions to log inputs, outputs, and system performance. Automate retraining pipelines to handle drift and use shadow testing or canary rollouts for safe model updates. The goal is to detect and fix problems before users notice.
AI Model Monitoring Framework: 4-Step Error Detection and Prevention Process
How to Build a Reliable AI Monitoring System Before Your Model Fails
sbb-itb-903b5f2
Common AI Model Errors
AI models might return a "200 OK" status with lightning-fast response times while producing completely fabricated outputs. This creates a unique challenge for monitoring - your infrastructure may seem flawless on the surface, but users could be receiving harmful or irrelevant results.
Error Types to Track
Here are some critical error types that require close attention.
Hallucinations happen when models generate outputs that are false but appear convincing. A striking example occurred in February 2024 when an Air Canada support chatbot fabricated a bereavement refund policy, resulting in an $812.02 penalty. Similarly, a lawyer faced judicial sanctions after citing six nonexistent cases in a legal brief.
Data drift happens when input patterns change, such as shifts due to seasonal trends. Concept drift, on the other hand, occurs when the relationship between features and outcomes changes, even if the input data itself looks unchanged. The Population Stability Index (PSI) can help detect these issues: a PSI below 0.1 signals no major drift, while a PSI of 0.2 or more calls for further investigation. Studies reveal that 91% of machine learning models degrade over time, losing their initial accuracy.
Operational failures include issues like latency spikes, throughput limitations, and API rate restrictions. For platforms like NanoGPT, which allow access to multiple models via a single API, monitoring metrics like Time to First Token (TTFT) and tokens per second is crucial. RAG-specific errors (retrieval-augmented generation) are another concern - these can stem from poor document chunking, which splits text awkwardly, or from irrelevant documents being surfaced as context.
Security risks are another major concern. In December 2023, a Chevrolet dealership’s chatbot was exploited through a prompt injection attack, allowing a user to negotiate the purchase of a 2024 Chevy Tahoe for $1. This forced the dealership to disable the chatbot entirely. Such attacks can bypass safety filters, expose sensitive information, or generate harmful content.
Why Catch Errors Early
Catching errors early is key to preventing silent failures that erode user trust. AIMon Labs emphasizes this point:
"A single incorrect answer, biased response, or hallucinated output can erode trust faster than any model benchmark can repair." - AIMon Labs
For those using NanoGPT's pay-as-you-go model, early detection is also a financial safeguard. Inefficient prompts and retrievals can quickly drain your budget if issues go unnoticed.
In agentic AI systems, errors can snowball. A single misstep in instructions can amplify risks and costs across an entire workflow. Alarmingly, around 85% of machine learning deployments fail after moving out of controlled environments, often because teams rely on reactive troubleshooting instead of proactive monitoring. Continuous monitoring with specialized evaluation models can slash costs by up to 97% compared to relying on standard large models for evaluation.
The real question isn’t whether your model will lose accuracy - it’s whether you’ll catch it before your users do. Real-time guardrails can validate AI outputs in roughly 300ms. Identifying problems before they reach customers helps you choose the right metrics and set up real-time alerts effectively.
Choosing Metrics for Monitoring
Once you've identified key error types, the next step is deciding which metrics to track. This boils down to monitoring three main areas: operational health, functional accuracy, and safety. Without clear metrics in place, it’s nearly impossible to spot when your model is underperforming, drifting, or wasting resources.
One big hurdle is the delay in receiving ground truth labels - the actual outcomes your model is predicting. These labels often take days or even weeks to arrive. Take a fraud detection model, for example: it might flag a transaction immediately, but verifying whether it was fraudulent could require a lengthy investigation. Because of this lag, relying solely on real-time accuracy metrics isn’t practical. Instead, you can use proxy indicators like data drift and prediction distribution shifts to catch silent failures early. Let’s break down the key metrics you should focus on for model quality, drift, and operational performance.
Core Metrics to Track
Model quality metrics assess how well your predictions align with reality. For classification tasks (like spam detection), keep an eye on accuracy, precision, recall, and F1-score. Regression models (such as price predictions) benefit from metrics like Mean Absolute Error (MAE) and Root Mean Squared Error (RMSE). Be cautious with metrics like Mean Squared Error, though - it’s sensitive to outliers, which can distort results and trigger unnecessary alarms.
To monitor drift, track changes in data and model behavior. This includes tools like PSI, KS tests, or Wasserstein distance to measure data shifts. Concept drift, where input-output relationships change, is another critical area to monitor. For instance, if customer preferences evolve, past purchase patterns may no longer predict future behavior. Prediction drift, on the other hand, focuses on shifts in the model’s output distribution, such as unexpected deviations in prediction rates compared to historical trends.
Data quality metrics help detect silent pipeline issues. These include missing values, null rates, schema mismatches, and outliers that might corrupt inputs without causing software errors. For platforms like NanoGPT that handle various model types, operational metrics like latency (inference time), throughput, and Time to First Token (TTFT) are critical for user experience. Pay close attention to p99 latency - even if the average latency is 200 ms, p99 latencies of several seconds can frustrate users.
For generative models, add specialized metrics like context adherence, factual accuracy, completeness, and confidence scores. These not only measure performance but also feed into real-time alerting systems.
Setting Thresholds and Alerts
Once you’ve outlined your metrics, the next step is setting thresholds. Start by establishing a 15–30 day rolling baseline using stable production data. This baseline serves as your reference for detecting anomalies. Use tiered alerts: for instance, a 1–3% drop in accuracy from the baseline might trigger a Slack warning, while accuracy falling below 75–80% could send a critical alert via PagerDuty.
For drift detection, use PSI thresholds: values below 0.1 indicate no major change, 0.1–0.2 call for attention, and anything above 0.2 requires immediate investigation. Set error rate alerts at 0.5% for warnings and 1% for critical issues. Similarly, latency alerts might trigger if p95 latency exceeds 500 ms for a warning or 2,000 ms for a critical alert.
To avoid alert fatigue, use duration-based alerts. For example, only trigger an alert if a metric exceeds its threshold for 5–30 minutes continuously. Start with more lenient thresholds to learn your model’s typical behavior, then tighten them over time. Every alert should include a runbook with clear steps, such as checking upstream data pipelines, verifying deployment status, or reviewing recent code changes.
Lastly, segment your monitoring by cohorts - like geography, device type, or user demographics. Aggregate metrics can hide localized problems. Research shows that 75% of businesses experience AI performance drops without proper monitoring, and error rates can spike by 35% on new data if models remain static for six months.
Setting Up Monitoring Systems
Creating a system to track and analyze performance revolves around three key elements: metrics (quantitative data like token usage), logs (event records and errors), and traces (the journey a request takes through your system). These components work together to give you a complete picture - metrics reveal what is happening, logs indicate when it occurred, and traces show where issues arise. This setup puts the metrics and thresholds you've defined into action, ensuring thorough data collection for error detection and performance monitoring.
Modern tools rely on instrumentation, which uses pre-built tools to collect data. For instance, OpenTelemetry offers a vendor-neutral way to export traces and metrics to various platforms.
"OpenTelemetry... seems to really be getting to the point where we can call it the Linux of Observability" - David Hope, Elastic
This flexibility means you can switch monitoring platforms later without overhauling your instrumentation code.
For platforms like NanoGPT, start by capturing key details from each API response: the id, model, usage (input/output tokens), and status from the /v1/responses endpoint. Use the store: true parameter to save responses for further analysis, and add custom metadata fields to label requests by user group, feature, or environment. If you're handling sensitive data, NanoGPT supports encryption headers (x-encryption-key or x-encryption-passphrase) to protect stored responses.
Logging and Observability
Good logging begins with structured formats like JSON, making it easier to search and filter data. Log not only errors but also successful requests, including details like latency, token usage, and model version. This baseline information is essential for diagnosing performance issues.
For NanoGPT workflows, record both input prompts and output responses locally on the user's device to prioritize privacy. Use the retention_days parameter (0–365 days) to define how long logs are stored, or set retention_days: 0 for privacy-sensitive requests. For tasks that may take up to 800 seconds, enable background: true, which returns a 202 Accepted status and allows you to poll for updates.
Tracking input and output tokens helps manage costs and identify issues like infinite retry loops or prompt injection attacks. For example, if the average token usage suddenly spikes from 500 to 4,000 tokens, it might signal malicious activity or a problem in your prompt setup.
Integrating Third-Party Tools
Third-party tools can expand your monitoring capabilities without requiring extensive infrastructure changes. These tools typically fall into three categories: SDK-based, proxy-based, and OpenTelemetry-based.
- SDK-based tools like Langfuse or Weights & Biases integrate directly into your code using decorators (e.g.,
@observeor@weave.op()) to automatically track traces, inputs, and outputs. For privacy-sensitive applications, you can configure them to avoid recording inputs and outputs (recordInputs: false,recordOutputs: false). - Proxy-based tools like Helicone act as intermediaries between your app and the AI provider. They require minimal setup - just update the API base URL and headers - and offer features like automatic logging, caching, and rate limiting. However, this method provides less control over what data gets logged.
- Tools like Datadog Watchdog or LinkedIn's AlerTiger use machine learning to detect anomalies, such as latency increases or unusual traffic patterns, that static thresholds might miss. For example, LinkedIn's AlerTiger monitors machine learning models for features like "People You May Know", identifying issues in feature values, prediction scores, and latency.
Once your data collection is in place, setting up real-time alerts ensures you can respond to problems immediately.
Configuring Real-Time Alerts
Poorly configured alerts can overwhelm teams with unnecessary notifications, leading to alert fatigue - when critical warnings are ignored because most alerts are false positives. Focus on actionable alerts that require immediate attention.
Set up tiered severity levels to prioritize notifications. Critical alerts (e.g., error rates exceeding 5%) should go to paging systems like PagerDuty, while less urgent warnings (e.g., cost anomalies or latency increases) can be sent to team chat tools like Slack. Use mute intervals for non-critical alerts during off-hours to reduce burnout, but keep critical alerts active around the clock.
Here’s an example of a practical alert configuration:
| Metric Category | Warning Trigger | Critical Trigger | Notification Channel |
|---|---|---|---|
| Latency | p95 > 5s | p99 > 10s | Slack / PagerDuty |
| Error Rate | > 1% | > 5% | Slack / PagerDuty |
| Data Drift (PSI) | > 0.1 | > 0.2 | Slack / Email |
| Model Accuracy | < 90% | < 85% | Email / PagerDuty |
| Daily Spend | > 20% over budget | > 1.5x yesterday | Slack / Email |
Each alert should include contextual metadata - like request ID, model version, error type, and affected user group - to help responders quickly understand and address the issue.
"Monitoring is not glamorous, but it is the difference between an AI agent that reliably delivers value and one that silently fails or wastes money" - Nawaz Dhandala, OneUptime
Finally, test your alerts by simulating failure conditions - such as stopping an agent, feeding it bad data, or creating a cost spike - to ensure the notification system works as intended. Incorporate monitoring into your CI/CD pipeline to catch problems with cloud or SaaS API connections immediately after deploying new model versions.
Managing Model Drift
AI models aren't static - they can falter over time as the world evolves. This decline, known as model drift, happens when the data your model encounters in production no longer matches the data it was trained on. It’s unavoidable: real-world data shifts faster than training data, leading to performance dips.
There are three primary types of drift to monitor. Data drift occurs when input distributions change - for instance, if your audience suddenly trends younger or starts using new devices. Concept drift happens when the relationship between inputs and outputs shifts, like when fraudsters adopt new strategies not accounted for during training. Finally, prediction drift is marked by changes in your model's outputs, even if the inputs remain steady.
"Models fail silently. Unlike application errors that throw exceptions, a degrading model continues to return predictions - just increasingly wrong ones." - Nawaz Dhandala
For text-based models, such as NanoGPT, you should track additional signals, including variations in text length, out-of-vocabulary word rates, shifts in prompt phrasing, changes in response formatting, spikes in hallucination rates, and reduced retrieval quality in retrieval-augmented generation (RAG) systems. Interestingly, 75% of organizations rank model monitoring as a high-priority task. Spotting drift early can save you from performance issues and rising operational costs.
Detecting and Validating Drift
Once drift is suspected, the next step is to measure and validate its impact using statistical tools. Start by creating a baseline using your training or validation dataset. Then, compare this baseline with production data using statistical tests designed to detect shifts.
For numerical features, the Population Stability Index (PSI) is a key metric. A PSI below 0.1 indicates no significant change, values between 0.1 and 0.2 suggest mild drift, and anything above 0.25 signals a major shift that needs immediate attention. For continuous data, the Kolmogorov-Smirnov (KS) test is effective; a p-value below 0.01 or 0.05 (depending on your tolerance) confirms significant differences. For categorical features, Chi-squared tests are useful for spotting frequency changes.
In text-heavy scenarios, training a domain classifier to differentiate between reference and production data can be highly effective. If the classifier achieves high accuracy (ROC AUC > 0.8), it’s a clear sign of drift. Additionally, monitoring metrics like average text length, out-of-vocabulary word proportions, and special character frequencies can provide valuable insights.
To detect concept drift, where input-output relationships change, keep an eye on your model’s error stream over time. Tools like ADWIN (Adaptive Windowing) or the Page-Hinkley test can flag changes in error rates or other performance metrics. A z-score greater than 3.0 in prediction changes can also indicate output drift.
When ground truth labels aren’t available or are delayed, human validation or "LLM-as-a-judge" methods - using advanced models like GPT-4 to review outputs - can offer a practical alternative. For NanoGPT workflows, features like secure local storage and metadata tagging can streamline evaluations against quality benchmarks.
Automating Retraining and Feedback
When drift is confirmed, automating retraining and feedback loops is essential to restore performance. Manual retraining can be slow and resource-heavy, so event-driven retraining is a better option. Here, monitoring systems trigger retraining pipelines the moment drift surpasses critical thresholds.
"The ideal approach is event-driven retraining - your system detects data drift, evaluates whether it is significant enough to impact model performance, and automatically kicks off a retraining pipeline." - Nawaz Dhandala, Founder, OneUptime
Set drift alerts (e.g., PSI > 0.25 or accuracy drops over 5%) to trigger automated pipelines that fetch fresh data, retrain the model, and validate it against a frozen benchmark. Include a Champion/Challenger step where the updated model must outperform the current version before deployment. To avoid wasting resources on minor fluctuations, set a minimum retraining interval (e.g., 24 hours) and require multiple drift indicators before initiating retraining.
Build robust feedback loops by collecting explicit signals (e.g., user ratings), implicit signals (e.g., session abandonment), and automated checks for consistency against retrieved context. Use asynchronous processes to log requests, responses, and metadata - such as latency, prompt versions, and token usage - without slowing down user interactions. This creates a rich dataset for retraining.
Before rolling out a retrained model, use shadow testing or canary rollouts to expose it to a small user group while keeping a rollback plan ready. Tracking details like prompt versions, system instructions, and retrieval configurations alongside model versions helps pinpoint the causes of drift.
Automated validation and adversarial input detection are vital for safeguarding against silent failures and security risks that could disrupt production systems.
"Feedback loops are the immune system of production AI. Without them, your application is frozen at launch quality, slowly drifting as the world changes." - Sheikh Mohammad Nazmul H., Software Developer
Testing and Refining Your System
Once your monitoring systems are in place, the next step is rigorous testing to ensure accuracy and responsiveness. Start by using a golden dataset - 1,000 to 2,000 labeled examples that include edge cases, ambiguous phrasing, and adversarial inputs. This dataset acts as your benchmark, allowing you to measure whether your monitoring tools can correctly identify errors and detect drift.
Run fixed prompts through your system while keeping variables like model temperature (between 0 and 0.2), prompt versions, and tool availability constant. This approach ensures that results are consistent and repeatable. Compare the system's alerts to the known correct and incorrect answers in your dataset. If more than 5% of responses deviate from the baseline, pause deployment. For added validation, you can incorporate advanced models to double-check the results. This process ensures your system reliably flags errors before moving into production.
Take the example of Samuel Patel, who deployed a customer-support assistant in October 2025 to handle 18,000 chats weekly. Initially, the system had a 2.4% hallucination rate, causing 160 escalations, and a p95 latency of 1.1 seconds. By introducing a test harness that boosted retrieval recall from 0.72 to 0.91, hallucinations dropped below 1%, and p95 latency improved to under 1.0 second. These adjustments reduced escalations by 28% and saved about 40 agent-hours daily.
Running Tests and Analyzing Results
At deployment, establish baselines for key metrics like latency, token usage, and hallucination rates. Aim for a TTFT (time to first token) under 500ms and total response times below 5 seconds. Production systems should achieve a request success rate above 99.5%.
To validate monitoring accuracy, use ground truth comparison. For example, match model predictions with delayed real-world outcomes, such as whether a flagged fraud case was accurate. This helps measure how well your monitors perform. Before full deployment, run your monitoring system in shadow mode, operating alongside existing tools to compare detection rates. This can reveal blind spots in your system, such as missed errors or false positives.
Monitor paired metrics to ensure improvements in one area don't come at the cost of another. For instance, balancing helpfulness with refusal rates or recall with precision is crucial. When using human judgment rubrics, target a Cohen's kappa score of at least 0.7 to ensure reliable evaluations. Turn production failures and user-reported issues into new test cases to close any gaps in monitoring and avoid repeating mistakes. This feedback loop helps refine your system over time.
Iterative Improvements and Deployment
When rolling out updates, use a gradual approach like canary releases, which expose 10–20% of traffic to the new version. Set auto-rollback triggers if error rates exceed 5% or p95 latency goes over 10 seconds. This method minimizes the risk of widespread issues affecting users.
Adjust alert thresholds based on the context and business impact. For instance, while a 10% hallucination rate might be fine for creative writing, it could be disastrous in a medical setting. As your system grows, move from manual thresholds to automated anomaly detection to account for shifting baselines and seasonal trends. Semantic caching, where answers with a cosine similarity above 0.9 are reused, can stabilize performance and cut costs, achieving hit rates between 40–70%.
For workflows like NanoGPT, local data storage and metadata tagging simplify validation against quality benchmarks while keeping sensitive data secure. Integrate behavioral tests into your CI/CD pipeline so that deployments automatically halt if monitoring detects major deviations. This creates a safety net, catching problems before they affect users and ensuring consistent system performance.
"Deploying an LLM without observability is like driving without a dashboard. You know you are moving, but you have no idea how fast, whether the engine is overheating, or how much fuel remains." - Swept.ai
Conclusion
Maintaining effective error monitoring is an ongoing process that requires a clear definition of success metrics, like keeping latency below 500 ms or achieving success rates above 99.5%. It's important to monitor both functional metrics (such as data quality, drift, and accuracy) and operational health (like throughput, error rates, and token usage) to ensure system reliability.
Large Language Models (LLMs) present unique challenges because they can fail silently, producing outputs that seem correct but are actually wrong. Unlike traditional software, these systems don't rely on standard crash indicators. As Nawaz Dhandala from OneUptime explains:
"LLMs in production are fundamentally different from traditional software systems. They are non-deterministic, expensive to run, and can fail in subtle ways that traditional monitoring cannot detect." - Nawaz Dhandala, OneUptime
NanoGPT provides tools to mitigate these challenges, including standardized status codes (e.g., completed, failed, incomplete), zero-retention configurations (retention_days set to 0), local storage, and encryption at rest. For performance optimization, it supports features like prompt caching for Claude and Gemini models, which helps cut down latency and costs. Additionally, the stickyProvider option minimizes expensive cache misses during failovers.
Model drift is another critical issue that can degrade performance over time. Solutions like automated retraining pipelines and challenger models are vital to maintaining benchmarks. Drift detection can be enhanced with tools like the Kolmogorov-Smirnov test for continuous data and chi-squared tests for categorical data. For improving factual accuracy, integrating real-time web search can boost results by up to 10×, with costs starting at $0.006 per request when using NanoGPT.
FAQs
What’s the fastest way to catch silent LLM failures?
The fastest way to spot silent failures in large language models (LLMs) is through proactive monitoring, which keeps tabs on both system uptime and the quality of outputs. Here’s how you can do it effectively:
- Output validation: Use tools like schema checks or regex matches to ensure outputs follow the expected format.
- Semantic evaluation: Incorporate methods like fact-checking or assessing classification accuracy to verify the content's reliability.
- Performance tracking: Monitor metrics such as latency and token usage to catch irregularities.
By implementing these strategies, you can quickly identify problems like inaccurate outputs or hallucinations before they affect users.
How do I pick drift metrics and PSI thresholds?
To choose drift metrics, begin with straightforward statistical tools such as PSI (Population Stability Index), KS (Kolmogorov-Smirnov), and Chi-square tests. These methods are effective for spotting shifts in data distributions. For PSI, the thresholds are typically interpreted as follows:
- Below 0.1: Minimal drift
- 0.1–0.2: Moderate drift
- Above 0.2: Significant drift
Adjust these thresholds based on your model's sensitivity and specific operational requirements to ensure reliable and meaningful monitoring.
What should I log to monitor quality, safety, and cost?
To keep tabs on AI model performance, safety, and cost, it's essential to log critical metrics. Focus on metrics like accuracy, relevance, and safety to identify issues such as hallucinations or harmful outputs. For efficiency, track latency, token usage, and response success rates.
Additionally, monitor resource consumption and allocate costs to specific features or users to catch any unexpected expenses. Keep detailed logs on data drift, prediction quality, and system errors to ensure the model remains safe and up to standard.