Multimodal Data Pipelines: Scalability Best Practices
Multimodal data pipelines handle diverse data types like text, images, audio, and video, powering systems such as autonomous vehicles and recommendation engines. Scaling these pipelines effectively is challenging due to the complexity and size of multimodal data. Here’s a quick summary of best practices for building scalable pipelines:
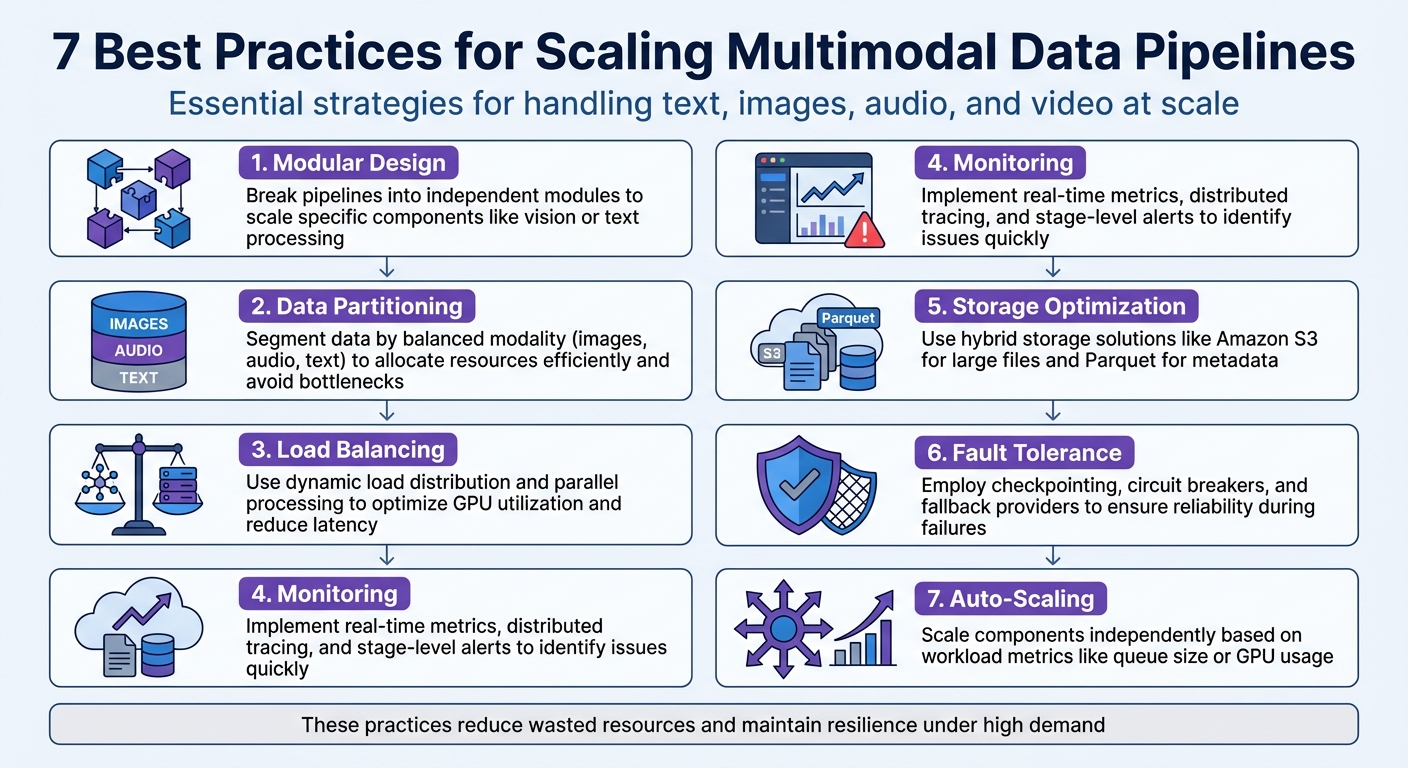
- Modular Design: Break pipelines into independent modules to scale specific components like vision or text processing.
- Data Partitioning: Segment data by modality (e.g., images, audio) to allocate resources efficiently and avoid bottlenecks.
- Load Balancing: Use dynamic load distribution and parallel processing to optimize GPU utilization and reduce latency.
- Monitoring: Implement real-time metrics, distributed tracing, and stage-level alerts to identify and resolve issues quickly.
- Storage Optimization: Use hybrid storage solutions like Amazon S3 for large files and Parquet for metadata to manage data efficiently.
- Fault Tolerance: Employ strategies like checkpointing, circuit breakers, and fallback providers to ensure reliability during failures.
- Auto-Scaling: Scale components independently based on workload metrics like queue size or GPU usage to handle traffic spikes.
Each of these strategies ensures pipelines run efficiently, reduce wasted resources, and stay resilient under high demand. Whether you’re managing terabytes of sensor data or aligning multiple data streams, these practices are essential for scalability and performance.
7 Best Practices for Scaling Multimodal Data Pipelines
Scaling Multimodal Data Curation with Ray and LanceDB | Ray Summit 2025
Checklist: Modular Pipeline Design
Break your pipeline into independent modules to address the specific needs of each data type. For instance, vision models often demand high memory bandwidth, while text models rely heavily on attention mechanisms. When pipeline stages are tightly interconnected, a surge in one area can disrupt the entire workflow. Modular designs solve this by letting each stage scale independently, based on its unique requirements.
The nanoVLM team previously showed how separating data preparation, using a "balanced greedy knapsack" strategy, improved GPU utilization.
"Scaling data pipelines is not about bigger servers, it is about smarter architecture." – Sumit Gupta, Lead Analytics Engineer, Notion
This approach ensures efficient scaling and smoother integration for future pipeline expansions.
Decoupling Data Sources and Processing Stages
Separating data sources from processing logic offers fault isolation and deployment flexibility. For example, if there's a sudden spike in image uploads, this won't disrupt the entire system. You can scale or restart only the affected section. This separation also makes upgrades easier - you can replace data connectors or update specific models without impacting other parts of the pipeline.
By treating each stage as its own service, you can deploy specialized GPU pools for different data types. Storing checkpoints and offsets in durable storage ensures that processing workers are easy to replace during failures. Dead letter queues handle problematic records separately, keeping the pipeline running smoothly. Standardizing intermediate representations, like structured JSON, ensures consistent outputs for downstream processes.
Standardized Interfaces Between Components
Standardized interfaces are essential for smooth communication between independently scalable modules. They eliminate the need for custom parsing and simplify integration. Using JSON schemas for model outputs ensures downstream components receive predictable data. A unified metadata structure - including timestamps, modality types, and lineage - helps integrate diverse data sources seamlessly. This is particularly important given that over 80% of enterprise data is unstructured, and autonomous vehicles can generate up to 100 GB of data per second.
Adopting tools like OpenTelemetry for data collection allows modules to work with various monitoring and analytics systems without custom setups. Standardized messaging interfaces, such as queues and streams, isolate failures and let each stage process data at its own speed, avoiding bottlenecks. Defining output schemas with Pydantic and using Docker to containerize modules further supports scalability, independent updates, and data consistency.
| Strategy | Benefit for Scalability | Implementation Tool Example |
|---|---|---|
| Decoupling | Enables independent scaling for components | Kafka, SQS, RabbitMQ |
| Containerization | Simplifies updates and isolates dependencies | Docker, Kubernetes |
| Standardized Schemas | Reduces complexity by avoiding custom parsing logic | JSON Schema, Pydantic |
| Observability Standards | Ensures consistent monitoring across workflows | OpenTelemetry, Prometheus |
Checklist: Data Partitioning and Sharding
Breaking datasets into smaller, manageable pieces helps avoid bottlenecks and ensures efficient processing tailored to each type of data. By partitioning based on modality, you can allocate resources in a way that minimizes conflicts across the pipeline. This approach allows for strategies that are specific to each type of data, making resource usage more efficient.
Partitioning Based on Data Modality
Each data modality should be treated as its own service, complete with individualized scaling. Instead of forcing all data types through a single infrastructure, you can configure specialized setups - like allocating GPU pools for visual tasks or creating distinct environments for processing text and audio.
"Deploying all stages on identical infrastructure creates contention and wastes resources. Instead, each stage should be treated as a separate service with its own scaling and scheduling behavior." – GMI Cloud
The way you segment data should match the type of data you're working with. For example:
- Images: Use object-centric visual chunking.
- Audio: Segment based on silence detection.
- Video: Apply scene-based splitting.
By using advanced segmentation techniques, you can avoid inefficiencies like unnecessary padding, ensuring better resource utilization.
Sharding for Horizontal Scalability
Once data is partitioned by modality, the next step is distributing these segments across multiple servers. Sharding allows you to scale horizontally by splitting data ranges based on worker IDs and the total number of workers. Tools like IterableDataset can help manage this process.
One effective method is Encode-Prefill-Decode (EPD) Disaggregation, which separates the multimodal encoding stage from the prefill and decode stages. This approach can lead to:
- Up to 15x lower peak memory usage.
- Batch sizes that are 22x larger.
- A 71% reduction in initial response time.
For fault tolerance during ingestion, tools like Kafka and checkpointing can be used for stream partitioning. Additionally, co-locating pipeline stages that handle large artifacts (e.g., high-resolution images or audio streams) can significantly reduce network latency and CPU/GPU transfer overhead. This setup ensures that even if one node fails, other shards can continue processing without interruption.
Checklist: Load Balancing and Parallel Processing
To keep your infrastructure running smoothly, it's crucial to distribute workloads effectively. Load balancing ensures no server gets overburdened while others remain idle, and parallel processing allows multiple types of data to flow through your system at the same time.
Dynamic Load Distribution
Dynamic load distribution builds on partitioning strategies to prevent bottlenecks. Simple methods like round-robin load balancing often fall short in complex multimodal pipelines, where processing times can differ drastically. For example, BERT might handle 10 tokens in just 5 milliseconds, but processing 512 tokens could take 250 milliseconds.
"Load balancing determines whether AI inference systems achieve 95% GPU utilization or waste 40% of compute capacity through inefficient request distribution." – Introl Blog
To address this, use GPU-aware scheduling that factors in real-time metrics like VRAM usage, compute power, and thermal conditions. This approach not only avoids out-of-memory errors but also accounts for hardware differences - like A100 GPUs processing tasks 1.7x faster than V100s in the same cluster.
Take OpenAI as an example: in December 2025, they handled 100 million daily ChatGPT requests using 128,000 GPUs. Their advanced load-balancing algorithms ensured smooth operation without bottlenecks. Netflix takes a similar approach with centralized load balancing for its recommendation system, managing 5 billion daily requests by distributing them across GPU tiers.
To further enhance reliability, implement circuit breakers with proxies like Envoy. These can automatically reject requests when GPU pools are overloaded, preventing cascading failures. Additionally, use connection pooling with persistent HTTP/2 or gRPC to reduce TCP handshake overhead by 20–30 milliseconds.
With these strategies in place, you’re set up for efficient load handling, paving the way for parallel processing to further cut down latency.
Parallelizing Multimodal Workflows
Stage-level scaling allows you to scale each component - such as vision encoders, audio processors, or text generators - independently, based on their demand.
"In production, multi-modal systems behave less like a model and more like a coordinated pipeline of specialized components." – GMI Cloud
To decouple pipeline stages, use message queues like AWS Kinesis or GCP Pub/Sub. This setup isolates components, letting them process data at their own speed, which helps smooth out traffic bursts and prevents system failures. For example, preprocessing images and generating text embeddings simultaneously can significantly reduce latency.
Dynamic batching, optimized through knapsack packing, can increase throughput by 3x to 10x while reducing wasted capacity. Grouping similar inputs - like images with identical resolutions - helps ensure GPUs stay evenly loaded. For stateful workflows, such as multi-turn chat with image context, use sticky sessions to route related requests to the same GPU instance, maintaining the necessary context.
These techniques ensure your multimodal pipeline runs efficiently, balancing workloads and leveraging parallel processing to handle even the most demanding tasks.
sbb-itb-903b5f2
Checklist: Monitoring and Observability
Without proper visibility into your pipeline, monitoring alone can't detect system issues effectively. Monitoring answers the question, "Is the system working?" while observability digs deeper to explain why something failed. This distinction becomes especially important in multimodal pipelines, where requests pass through components like text processors, vision encoders, and audio transcription services. Identifying bottlenecks in such complex systems is crucial.
"The challenge with these pipelines is observability. When a request involves three or four different models, each with its own preprocessing and postprocessing steps, figuring out where things went slow or wrong becomes a real headache." – Nawaz Dhandala, Author, OneUptime
A modular design can simplify this process by narrowing down potential failures to just 20–40% of the system instead of requiring a full-system analysis. For example, in 2024, the Washington Nationals used Prefect's centralized monitoring to unify data from multiple APIs. This allowed them to automate responses to common issues and achieve full visibility across both cloud and legacy systems. With this foundation, you can move on to gathering detailed metrics.
Real-Time Metrics Collection
Capturing real-time metrics like throughput, latency per modality, and resource usage is essential for spotting scaling issues early. While text processing might take milliseconds, audio transcription often requires twice as much time. Keep an eye on GPU memory pressure, queue depth, and overall CPU, memory, and GPU usage.
Input dimensions matter. Tracking token counts for text, image resolutions, and audio durations can help you connect performance drops to specific input characteristics.
To dive deeper, use distributed tracing tools like OpenTelemetry. These tools let you follow a request through different stages of the pipeline. For better clarity, create custom spans for each processing step - preprocessing, model inference, and fusion - using a naming convention like {modality}.{step} (e.g., audio.transcribe or image.preprocess). In parallel workflows, ensure trace context propagates across threads so that child spans correctly link back to the parent trace.
Centralize logs and metrics from all components - whether they're running on AWS Lambda, Docker, or legacy systems - into a single dashboard. Tag each run with a unique UUID to simplify troubleshooting and avoid the hassle of sifting through logs from multiple systems.
Once your metrics are in place, the next step is setting up timely alerts to handle potential issues as they arise.
Alerting and Anomaly Detection
Define modality-specific thresholds for alerts since processing times and error rates can vary significantly between data types. For instance, LLM-based components might trigger an alert if p95 latency exceeds 10 seconds or error rates go above 1%. Similarly, audio transcription naturally takes longer than text processing, so thresholds should reflect these differences.
| Metric Category | Key Indicators | Alert Threshold |
|---|---|---|
| Latency | p50, p95, p99 response time | p95 > 10s |
| Errors | Rate limit hits, API errors | Error rate > 1% |
| Resources | GPU memory, queue depth | Custom per modality |
| Quality | Embedding similarity, model drift | Deviation from baseline |
Go beyond monitoring just the final output by implementing stage-level alerting. This helps pinpoint issues to specific services - like a vision encoder - without causing disruptions across the entire pipeline. Additionally, watch for model drift by comparing incoming data distributions to the training data. If embeddings for new inputs like images or text deviate too much, trigger alerts for retraining.
Set up alerts to initiate diagnostic checks automatically. For instance, if retrieval accuracy in a multimodal search system drops, the system could verify whether the vector database index needs updating. When a model fails, log the error by setting the span status to ERROR and including the exception details.
Checklist: Distributed Storage and Compute Optimization
To scale effectively, it's crucial to have robust storage and compute strategies tailored to your workload. For instance, compressed images can inflate up to 20 times their disk size when decoded in memory, and a single autonomous vehicle can churn out between 1 and 4 terabytes of sensor data daily. Properly allocating storage and compute resources is essential to avoid system failures.
Choosing the Right Storage Solution
Your storage setup should align closely with your pipeline's demands. For real-time data ingestion, such as live video feeds or sensor inputs, Apache Kafka is a strong choice for managing message queuing and triggering events. On the other hand, Apache Spark is better suited for batch processing and handling complex transformations on large historical datasets.
For workloads involving multiple data types, a hybrid storage approach works best. Store large files like videos or high-resolution images as blobs in object storage (e.g., Amazon S3 or Azure Blob), while keeping metadata and file references in structured formats like Parquet for efficient querying. If your pipeline involves similarity searches across embeddings, integrating a vector database, such as Milvus or Solr, can significantly speed up these operations.
When sizing your storage, focus on peak intermediate data rather than just raw input. Formats like Parquet can expand 2 to 4 times in memory during resource-intensive operations like shuffles, joins, or sorts.
"Cluster size is not derived from data size. It is derived from workload behavior." – Arjun Krishna, Solutions Engineer
To avoid production bottlenecks, plan for the 95th percentile of your workload, such as spikes during quarter-end processing. This ensures your storage strategy supports the compute optimizations discussed below.
Compute Resource Allocation
Efficiently balancing CPU and GPU resources is key to preventing bottlenecks and managing costs. A July 2025 benchmark revealed that increasing the CPU-to-GPU ratio from 4 CPUs to 16 CPUs per GPU reduced the cost per run from $0.82 to $0.43. This improvement came from eliminating CPU starvation and shortening execution times. Such adjustments highlight the importance of dynamic resource allocation for scalability and cost control.
Modern tools like Ray Data allow you to scale CPU and GPU workers independently without requiring changes to your codebase. By using a streaming execution model, you can pipeline tasks across different resources, maximizing utilization and minimizing idle periods.
To avoid memory overruns, implement backpressure mechanisms. For example, if GPU inference slows down, upstream processes should adjust their pace accordingly. These compute optimizations, combined with a solid storage strategy, help maintain a scalable and efficient pipeline.
Checklist: Fault Tolerance and Auto-Scaling
Failures are bound to happen in multimodal pipelines. The difference between a small inconvenience and a complete breakdown lies in how well your system manages these disruptions.
Redundancy and Failover Mechanisms
Creating reliable pipelines means building fault tolerance at three levels: worker processes (to handle GPU out-of-memory errors), worker nodes (to address hardware failures or preemptions), and job drivers (to recover from head node crashes). Each level demands a tailored recovery approach.
Checkpointing serves as a critical safeguard. By asynchronously saving model weights and processing states to persistent storage like Amazon S3 or NFS, you can minimize disruptions. This typically costs between $100 and $500 per month, depending on model size. For example, AWS S3 charges approximately $0.023 per GB per month. Beyond cost savings, this strategy can significantly reduce response times - cutting Time to First Token from 5.5 seconds to 3.8 seconds. Advanced techniques, such as combining asynchronous checkpointing with anomaly detection, have even reduced GPT-3 175B pre-training time by 28%.
The circuit breaker pattern is another key tool for preventing cascading failures caused by external API issues. When a component exceeds a failure threshold, the circuit "opens", halting traffic to it and initiating a cooldown period before retrying. For large language model (LLM) APIs, lightweight health checks every 30 seconds - like sending a "Respond with OK" prompt - can help ensure availability before directing user traffic.
"If your production system depends on a single LLM provider, you have a single point of failure that will eventually take your application down." - Grizzly Peak Software
To avoid this single point of failure, maintain a priority-ordered list of fallback providers. When your primary API encounters rate limits or outages, route traffic to alternatives automatically. For multimodal systems, ensure backup providers can handle the same capabilities. For instance, if your primary model processes vision inputs, your fallback must support those as well. You can also implement latency-based failover: set thresholds like a 15-second maximum response time for chatbots. If a provider exceeds this limit, switch to a faster alternative, even if the original provider is still technically operational.
Once fault tolerance is in place, the next step is ensuring your system can adapt to changes in demand with effective auto-scaling.
Implementing Auto-Scaling Policies
Dynamic auto-scaling works alongside fault tolerance to keep performance steady during unexpected traffic spikes. For multimodal pipelines, scaling should happen at the stage level rather than uniformly across the system. For example, a surge in image processing shouldn't trigger unnecessary scaling of text generation resources. Scale vision, audio, and text components independently based on their specific workloads.
Choosing the right metrics is crucial. Queue size is ideal for maximizing throughput and controlling costs while staying within latency targets. On the other hand, batch size is better for applications where quick response times are critical, as queue-based scaling might react too slowly. Use metrics specific to each modality, such as GPU memory usage and queue depth, and set a default 5-minute stabilization window to avoid frequent scaling adjustments. Also, consider the Horizontal Pod Autoscaler (HPA) tolerance, which typically has a 0.1 no-action range to prevent unnecessary scaling for minor fluctuations. Set clear limits on how many replicas can be added or removed within a specific time frame to ensure smooth scaling.
For added resilience, configure graceful degradation. If your high-performance GPU cluster goes offline, the system can switch to simpler models, CPU-based processing, or cached responses instead of failing entirely. This ensures users experience minimal disruption, maintaining their trust even during partial outages.
Conclusion: Key Takeaways for Scalable Multimodal Pipelines
Building scalable multimodal pipelines is all about smart system design - not just throwing more hardware at the problem. The practices outlined here tackle key production challenges like wasted compute power, poor data management, and rigid architectures that can’t keep up with shifting demands.
For instance, adopting knapsack strategies can cut wasted GPU cycles by up to 60%. The nanoVLM team showed how using producer-consumer patterns with Python queues slashed idle GPU time significantly. As GMI Cloud put it, "teams that succeed with multi-modal deployment treat the pipeline itself as a first-class system". These approaches not only improve GPU usage but also set the stage for platforms like NanoGPT to offer consistent, cost-efficient, and dependable multimodal services.
FAQs
How should I split a multimodal pipeline into modules?
When designing a pipeline, it helps to divide it based on modalities and processing stages. This can be approached using strategies like:
- Mixed partitioning: Processing multiple modalities together within the same stage.
- Modality-aware partitioning: Separating stages based on the unique characteristics of each modality.
Key factors to consider include the heterogeneity of data types, the computational load each stage requires, and how stages depend on one another.
Typical pipeline modules often include:
- Data ingestion: Collecting and preparing raw data from various sources.
- Feature extraction: Transforming raw data into meaningful representations.
- Fusion: Combining data from different modalities for unified analysis.
- Downstream tasks: Applying the processed data to specific applications or models.
This modular approach ensures better load balancing, scalability, and easier maintenance. Plus, it can adapt to both real-time processing and batch processing requirements, depending on the system's needs.
What’s the best way to partition and shard data across text, image, audio, and video?
To handle scalability effectively, start by preprocessing and standardizing each type of data. For example, tokenize text, resize images, or convert audio into spectrograms. Before sharding, ensure this step is complete. Partition the data based on features specific to each modality, then align it using timestamps or metadata for consistency.
Incorporate modular architectures and use encoders tailored to each modality to enable parallel processing. These steps help balance the load, maintain synchronization, and scale multimodal pipelines more efficiently.
What metrics should I monitor to detect bottlenecks early?
Monitoring throughput (tokens per second), latency, and error rates is crucial for spotting bottlenecks early - before they affect users. These metrics give you a clear picture of how your pipeline is performing, allowing you to tackle potential issues head-on.