
Latency Profiling for Large Language Models
Latency profiling is essential to improve the performance of large language models (LLMs). These models operate in two main phases: the compute-heavy "prefill" phase (processing input) and the memory-intensive "decode" phase (generating tokens). Each phase has unique hardware demands, making it critical to identify and resolve bottlenecks.
Key metrics like Time to First Token (TTFT), Time Per Output Token (TPOT), and End-to-End (E2E) latency help measure responsiveness and efficiency. For example:
- TTFT measures how quickly the first token is generated (ideal: under 500 ms for chatbots).
- TPOT tracks the time between tokens (e.g., 10–20 ms on a 7B model with an NVIDIA A100).
Distributed systems add complexity due to network delays, memory pressure, and communication overheads, especially during the decode phase. Profiling tools like PyTorch Profiler, NVIDIA Nsight Systems, and OpenTelemetry are used to identify inefficiencies in GPU usage, memory bandwidth, and scheduling.
Optimizing latency involves balancing trade-offs:
- Larger batch sizes improve throughput but increase latency.
- Separating prefill and decode phases reduces interference but adds data transfer delays.
Techniques like continuous batching, quantization (e.g., INT8), and FlashAttention can significantly lower latency. For example, the NVIDIA H100 GPU offers 36% lower latency than the A100 due to higher memory bandwidth.
Distributed tracing and profiling dashboards (e.g., OpenTelemetry, Ray Serve LLM) provide real-time insights, helping teams fine-tune performance and meet user expectations. Profiling ensures LLM systems deliver faster, cost-efficient, and reliable results, whether for chatbots, code completion, or other applications.
Christian Merkwirth (NVIDIA): Optimizing LLM Inference: Challenges and Best Practices
sbb-itb-903b5f2
Core Metrics and Profiling Signals for LLM Latency
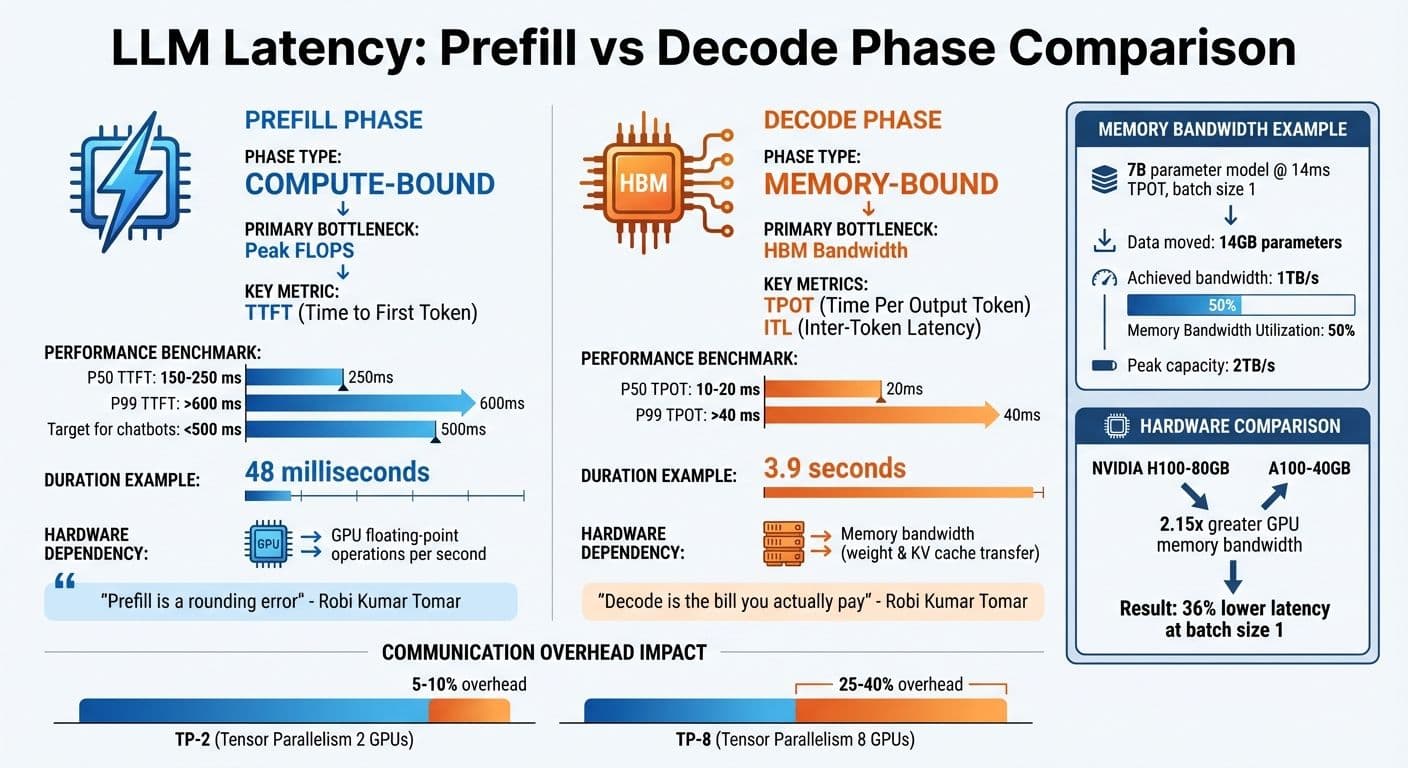
LLM Latency Metrics: Prefill vs Decode Phase Performance Comparison
Key Metrics for Latency Profiling
When profiling latency in large language models (LLMs), percentile distributions are invaluable. For instance, a 7B model running on an A100 GPU exhibits a P50 TTFT (Time to First Token) between 150–250 ms, while P99 TTFT can surpass 600 ms. Similarly, TPOT (Time Per Output Token) ranges from 10–20 ms at P50 and exceeds 40 ms at P99.
Another critical metric is Inter-Token Latency (ITL), which measures the time gap between tokens. Unlike TPOT, which averages latency across all requests, ITL highlights token gap variability, especially for longer responses. This makes ITL particularly useful for assessing streaming performance in distributed inference setups, where even minor delays can compound across multiple nodes.
Goodput, a newer metric, focuses on requests that meet specific Service Level Objectives (SLOs), such as a TTFT under 500 ms. While high throughput is often the goal, its value diminishes if latency SLOs aren’t met. These metrics help identify bottlenecks in hardware and scheduling, enabling more focused profiling efforts.
Profiling Signals to Capture
To uncover latency bottlenecks, capturing hardware signals is crucial. These signals are especially important in distributed inference, where small inefficiencies can have a cascading effect. Metrics like GPU utilization, power consumption, and peak VRAM usage provide insights into system performance. For example, as output sequences grow, the increasing size of the KV-cache adds memory pressure and intensifies attention computation. Maintaining steady ITL under these conditions signals efficient memory management.
Another critical factor is inference scheduler queuing time, which can introduce delays not captured by compute metrics alone. In single-concurrency scenarios, overheads like input preparation and response storage can contribute up to 33% of the total benchmark duration. While adding concurrency may improve throughput, it eventually hits a saturation point where latency increases and overall tokens per second (TPS) begins to drop.
Common Instrumentation Techniques
Once key metrics and signals are identified, effective instrumentation is needed to measure and address latency issues. A multi-layer approach works best:
- Application-level tools like OpenTelemetry can track end-to-end metrics (e.g., TTFT, ITL) by timestamping tokens. Real-time computation of these metrics is possible by intercepting streaming response chunks.
- Kernel-level profiling with tools like the PyTorch Profiler provides detailed insights into kernel execution times and call stacks.
- NVIDIA Nsight Systems helps analyze GPU performance, offering data on register usage, shared memory occupancy, and CUDA events. Using NVTX markers, you can annotate specific code regions or model layers for a more granular view of bottlenecks.
When correlating Python code with CUDA kernel execution in Nsight Systems, it’s important to disable CUDA Graphs to ensure NVTX markers are captured accurately.
For quick testing configurations without the overhead of loading full model weights, use a dummy weight format (e.g., --load-format dummy). Additionally, you can narrow profiling to specific iteration ranges using environment variables like TLLM_PROFILE_START_STOP (e.g., focusing on iterations 100–150). This targeted approach reduces noise and helps isolate performance issues efficiently.
Profiling Latency Across Distributed Inference Dimensions
Major Contributors to Latency
When it comes to large language model (LLM) inference, latency is shaped by two key phases, each with distinct demands on hardware. The prefill phase processes the input prompt and is primarily compute-bound, relying heavily on the GPU's ability to execute floating-point operations per second (FLOPS). On the other hand, the decode phase handles token generation, one token at a time, and is memory-bound, depending on how efficiently the system can transfer weights and KV cache data from memory to GPU cores.
To illustrate, a profiled multi-GPU setup showed that the prefill phase completed in just 48 milliseconds, while the decode phase took a much longer 3.9 seconds. As Robi Kumar Tomar aptly summarized:
Prefill is a rounding error. Decode is the bill you actually pay.
When multiple GPUs are used with tensor parallelism (TP), communication overhead becomes a major bottleneck during the decode phase. For every token generated, NCCL collectives are triggered. With TP-2, this overhead typically adds 5–10%, but with TP-8, it can climb to 25–40%, potentially negating the benefits of parallelism.
Pipeline bubbles also contribute to inefficiencies in pipeline parallelism (PP). These occur when devices remain idle, waiting for activations from earlier layers, resulting in 20–40% idle time. Memory bandwidth utilization (MBU) offers a clearer perspective. For example, a 7B parameter model running at 14ms TPOT with batch size 1 moves 14GB of parameters, achieving 1TB/s bandwidth. On a machine with a 2TB/s peak capacity, this equates to 50% MBU.
These contributors form the foundation for understanding the trade-offs involved in designing distributed inference systems.
Trade-Offs in System Design
The latency factors outlined above highlight several trade-offs that system designers must navigate to balance performance and efficiency.
One key insight from profiling is that increasing batch size can improve total throughput by spreading model weight loading across multiple requests. However, this comes at the cost of higher per-request latency. For instance, in the case of the Qwen 2.5 7B model, increasing the batch size from 1 to 8 reduced per-request latency from 976 milliseconds to 126 milliseconds.
Another significant trade-off involves the decision to colocate prefill and decode phases on the same GPU or separate them into distinct compute pools. Colocating these phases can lead to resource interference, causing TPOT to spike by 2x–30x during bursts. In contrast, disaggregating them avoids interference but introduces a "transfer tax" for moving the KV cache across the network. If the transfer latency exceeds the time it would take to recompute the prefill locally, this approach can degrade performance by 20–30%.
| Metric | Phase | Bottleneck Type | Primary Hardware Limit |
|---|---|---|---|
| TTFT | Prefill | Compute-bound | Peak FLOPS |
| TPOT | Decode | Memory-bound | HBM Bandwidth |
| ITL | Decode | Memory/Comm-bound | Bandwidth / Interconnect Latency |
Profiling enables the creation of a Pareto frontier, which maps request throughput against end-to-end latency across varying concurrency levels. This helps identify the optimal "operating point" where the system achieves maximum efficiency without breaching latency SLAs. For example, in early 2026, DigitalOcean partnered with character.ai to refine distributed parallelism strategies using this approach, successfully boosting request throughput while adhering to strict latency requirements.
Since the decode phase is the primary source of latency in most cases, optimization efforts should target memory bandwidth improvements. Techniques like quantization (e.g., INT8/4-bit) and attention mechanisms like FlashAttention can yield better results than merely adding more GPUs. For instance, the NVIDIA H100-80GB, with 2.15x the GPU memory bandwidth of the A100-40GB, delivers 36% lower latency at batch size 1.
Latency Profiling Techniques for LLMs
Token-Level and Iteration-Level Profiling
Profiling the inference process of large language models (LLMs) involves measuring performance at two key levels: token-level, which focuses on the generation of individual tokens, and iteration-level, which evaluates the entire autoregressive loop. Two critical metrics are used here:
- Time to First Token (TTFT): This measures how long the prefill phase takes.
- Time per Output Token (TPOT): Calculated as
(Total Latency - TTFT) / (Tokens - 1).
To identify issues like jitter and throttling, Inter-Token Latency (ITL) tracks the time between consecutive token generations.
Several tools and techniques help with this type of profiling:
- PyTorch Profiler: Captures detailed traces of CPU operations and GPU kernel executions. Enabling
with_stack=Truelinks these operations to specific lines of code. - NVTX markers: Used to annotate specific code regions, such as prefill or decode boundaries, which can then be visualized in tools like NVIDIA Nsight Systems.
- TensorRT-LLM: Allows profiling of specific iterations using environment variables (e.g.,
TLLM_PROFILE_START_STOP=A-B), which helps reduce trace sizes and filter out warmup noise.
In distributed setups, profiling becomes more complex. Prefill and decode workers need to be analyzed separately due to their distinct hardware usage. Systems like SGLang simplify this by merging profiling traces from distributed configurations that may use Tensor, Pipeline, or Data Parallelism. When using NVTX markers in such setups, disabling CUDA graphs (e.g., --disable-cuda-graph in SGLang) ensures the markers are correctly emitted.
These profiling techniques form the foundation for improving scheduling and batching strategies in LLM inference.
Batching and Scheduler Profiling
Efficient scheduling is crucial for minimizing latency during distributed inference. One effective method is continuous batching, where completed requests exit and new ones enter at each decoding iteration. This reduces GPU idleness caused by varying output lengths. In contrast, static batching often leads to inefficiencies, with compute utilization dropping to as low as 53.8% due to wasted iterations on padding tokens.
Michael Brenndoerfer highlights the advantage of continuous batching:
The key insight behind continuous batching emerges from a careful examination of how autoregressive generation actually works... At this boundary, we have complete freedom to reorganize which requests participate in the next iteration.
A practical example comes from Jian Tian's team at DeepSeek. In December 2025, they implemented Staggered Batch Scheduling (SBS) on a production H800 cluster running the Deepseek-V3 model. By buffering requests and using Load-Aware Global Allocation, they reduced TTFT by 30%–40% and boosted throughput by 15%–20% compared to baseline scheduling.
To profile scheduling efficiency, tools like bench_serving provide real-world serving metrics (TTFT, TPOT, ITL), while bench_offline_throughput measures maximum throughput without HTTP overhead. Another optimization, chunked prefill, splits long prompts into smaller chunks (e.g., 512 tokens) to prevent lengthy prefill tasks from delaying decode iterations, which can lead to latency spikes. Monitoring ITL is key - spikes from 15ms to 80ms often indicate hardware throttling or suboptimal hardware configurations.
Parallelism Strategy and Communication Profiling
Once token-level and scheduling metrics are captured, understanding communication overheads in distributed setups is essential for optimizing LLM inference. Communication overheads are measured by tracking both the volume and latency of collective operations across parallelism strategies. Here's how different strategies compare:
- Tensor Parallelism (TP): Relies on high-bandwidth intra-node Allreduce operations.
- Pipeline Parallelism (PP): Uses point-to-point send/receive operations, which are more sensitive to inter-node latency.
Hardware interconnects significantly affect communication latency. For example, NVLink on H100 GPUs delivers 450 GB/s per direction, while PCIe 5.0 is limited to 64 GB/s.
Collective communication micro-benchmarking tools like NCCL tests can measure latency and bandwidth for primitives (e.g., Allreduce, Allgather, All-to-All) across message sizes ranging from 32 KB to 16 GB. Additionally, layer-wise annotation with NVTX markers attributes communication and kernel execution costs to specific layers, such as attention or MLP blocks, within the distributed execution timeline.
| Parallelism Type | Primary Collective | Approx. Volume |
|---|---|---|
| Data Parallel (DDP) | Allreduce | 2 × Parameter Count |
| ZeRO-3 | Allgather + Reduce-Scatter | 3 × Parameter Count |
| Tensor Parallel (TP) | Allreduce | (12L + 2) × bsh × (t-1)/t |
| Pipeline Parallel (PP) | P2P Send/Recv | 2 × bsh × (p-1) |
Running concurrency sweeps (1–128) helps map throughput against latency, identifying the best hardware utilization while meeting SLA requirements. For example, training a 175B parameter model on 12,288 GPUs achieved only 55.2% Model FLOPs Utilization (MFU), largely due to communication bottlenecks. Profiling these aspects is crucial for uncovering inefficiencies and fine-tuning performance.
Tools and Systems for Latency Profiling
Model-Serving Systems with Profiling Features
Latency profiling for distributed inference often combines model-serving systems, hardware tools, and tracing solutions. Many inference systems now come equipped with profiling tools that track latency at both the token and request levels. For instance, Sarathi-Serve tackles the throughput-latency balance by using chunked-prefills, which split prefill requests into equal parts to reduce stalls. Benchmarks show it delivers impressive results, achieving 2.6x greater serving capacity for Mistral-7B on a single A100 GPU, and up to 5.6x gains for Falcon-180B using pipeline parallelism compared to vLLM.
Another tool, GenAI-Perf (soon to be AIPerf), includes a command-line interface (CLI) for measuring metrics like TTFT, ITL, and throughput. It also generates visualizations, such as TTFT versus input sequence length or inter-token latency versus token position. With its compare subcommand, users can easily analyze performance differences between server versions or model configurations. Meanwhile, the Dynamo Profiler (CLI) automates both offline and online performance evaluations. Its AI Configurator profiles TensorRT-LLM setups offline in just 20-30 seconds, while online profiling with AIPerf can take 2-4 hours for maximum precision.
When more granular insights are needed, hardware profilers provide a closer look at GPU and kernel performance.
GPU and Hardware Profilers
NVIDIA Nsight Systems offers application-level performance tracking using NVTX markers and CUDA APIs, allowing users to examine kernel timings and pinpoint memory bottlenecks. As NVIDIA explains:
Nsight Systems reports at the application level are highly informative... and provide a clean middle-ground between timing analysis and kernel-level deep dives.
To focus on specific iterations and reduce trace sizes, you can use the TLLM_PROFILE_START_STOP=A-B variable.
For an even deeper analysis, DLProf builds on Nsight Systems by linking high-level model operations to low-level GPU activities. It simplifies iteration detection by identifying key nodes that execute once per batch, enabling aggregated performance reports. When Tensor Cores are used for mixed-precision operations, LLM architectures can achieve up to a 3x speedup in computationally heavy tasks. For real-time metrics, tools like Perf Analyzer support the --collect-metrics flag to pull GPU power and memory data from Prometheus endpoints.
These hardware tools lay the foundation for broader system observability through distributed tracing.
Distributed Tracing and Custom Dashboards
Once low-level GPU activity is captured, distributed tracing frameworks help link these metrics to overall system performance. For example, OpenTelemetry integration with Triton Inference Server generates detailed traces for each inference request. A basic trace includes three spans: top-level (request/response timestamps), model (queue and start/end times), and compute (inference execution). The Batch Span Processor helps reduce latency overhead by grouping spans - just ensure bsp_max_queue_size is set high enough to capture all spans.
For more advanced observability, Ray Serve LLM integrates Prometheus and Grafana dashboards specifically tailored for LLM metrics. These dashboards display key data like TTFT, TPOT, and GPU KV cache usage. In Ray Serve deployments, enabling log_engine_metrics (default in version 2.51+) ensures vLLM-specific performance data is captured. Additionally, the Dynamo Profiler WebUI offers an interactive dashboard for analyzing tensor parallelism settings and exploring performance data across various configurations.
Applying Latency Profiling to NanoGPT
Optimizing Latency for NanoGPT Users
In NanoGPT's pay-as-you-go model, every millisecond matters. Metrics like Time to First Token (TTFT) measure how quickly users see the model start generating text, while Time Per Output Token (TPOT) ensures smooth and steady streaming. As Nawaz Dhandala aptly puts it:
In LLM operations, latency is not just a performance metric. It directly impacts user experience, cost efficiency, and system reliability.
A key focus is monitoring P99 latency - the 99th percentile of response times. This helps identify the worst-case scenarios that could frustrate users, especially during high-demand periods or when local devices face thermal throttling. Additionally, keeping a close eye on inter-token latency (ITL) is essential to maintain seamless text generation.
The next step involves examining how local devices manage CPU and GPU coordination to uncover potential delays.
Profiling Local Device Overheads
NanoGPT relies on local storage, making it crucial to profile how CPUs and GPUs work together. Using the PyTorch profiler with options like record_shapes=True and with_stack=True can reveal delays in kernel launches and memory transfers. As Underfit.ai highlights:
Understanding where training time is spent is essential for optimization. We can use the PyTorch profiler to capture traces that visualize the timeline of CPU operations, GPU kernel execution, and the coordination between them.
One critical area to monitor is GPU idle time - moments when the GPU isn’t actively processing and sits unused. For devices with limited VRAM, such as a 24 GB RTX 4090, it’s important to analyze whether performance bottlenecks stem from memory bandwidth or compute capacity.
These insights not only drive internal improvements but also provide valuable transparency for NanoGPT users.
Exposing Profiling Insights to Users
Sharing latency statistics with users helps them make smarter decisions when choosing models from NanoGPT's catalog. For instance, displaying per-model TTFT and TPOT values allows users to weigh cost versus responsiveness based on their specific needs. Someone generating long-form text might accept a slightly slower TTFT if TPOT remains efficient, while a user focused on code completion would likely prioritize both metrics being as low as possible.
To further improve performance, semantic caching can handle 30–40% of recurring requests. Additionally, response caching has shown to deliver up to a 4× speedup, cutting latency from 12.7 ms to just 3.0 ms in some workflows. By presenting metrics like cache hit rates and average speedup, NanoGPT empowers users to strike the right balance between cost efficiency and responsiveness.
Conclusion
Latency profiling is changing the game for distributed LLM operations, turning complex, abstract challenges into actionable insights. By identifying compute limits and memory bandwidth constraints, teams can optimize performance more effectively. As Piyush Srivastava from DigitalOcean explains:
If you optimize for latency alone, your cost-per-token suffers; if you optimize for throughput alone, latency suffers. Without a framework, it soon becomes a game of 'whack-a-mole'.
Take the Modded-NanoGPT project as an example. In November 2025, it leveraged PyTorch profiling across 8 NVIDIA H100 GPUs to drastically cut training time for a 124M parameter model - from 45 minutes to under 2.5 minutes. Systems like LatencyPrism are also making waves, monitoring thousands of processors in real time and detecting anomalies with an impressive 0.98 F1-score.
NanoGPT's pay-as-you-go model benefits heavily from these profiling techniques. Users can fine-tune the balance between Time-to-First-Token (TTFT) and Throughput-per-Token (TPOT), ensuring workloads align with their specific needs. Beyond performance gains, profiling builds user confidence by delivering transparent and predictable latency metrics.
This becomes even more crucial as on-device inference grows in popularity. Running models locally - whether on a mobile GPU or a consumer-grade RTX card - requires squeezing maximum efficiency out of limited hardware. Profiling strategies help achieve this, ensuring smooth and reliable execution while maintaining privacy.
FAQs
Which metric should I optimize first: TTFT, TPOT, or ITL?
The metric you should focus on first depends largely on your application's purpose and the experience you're aiming to deliver to users. Typically, Time to First Token (TTFT) is the top priority. Why? It directly affects how responsive your system feels to users. A faster TTFT means quicker initial feedback, which can significantly boost user engagement and make your system feel snappier.
While Token Per Output Token (TPOT) and Inter-Token Latency (ITL) are also valuable metrics to consider, starting with TTFT lays a solid foundation for better performance and user satisfaction.
How can I tell if decode latency is memory-bound or network-bound?
To figure out whether decode latency is tied to memory or network limitations, you’ll need to dig into its performance traits. Memory-bound latency happens when the system is constrained by memory bandwidth, while network-bound latency is driven by the time it takes to transfer data over the network.
Using profiling tools can make this process easier. If latency grows with memory access patterns, it’s likely memory-bound. On the other hand, if it increases alongside network transfer times, the bottleneck is probably network-related. The key is to track whether latency aligns more with memory activity or network operations to zero in on the root cause.
What’s the quickest profiling setup to find my biggest latency bottleneck?
The quickest way to spot latency issues is by using a profiling tool to map out your model's operation timeline. The PyTorch profiler, when paired with NanoGPT during inference, records detailed CPU and GPU activity traces. By incorporating it into your NanoGPT code, you can analyze the trace to identify delays and uncover performance bottlenecks with precision.