How Real-Time Traffic Monitoring Enhances AI Model Scalability
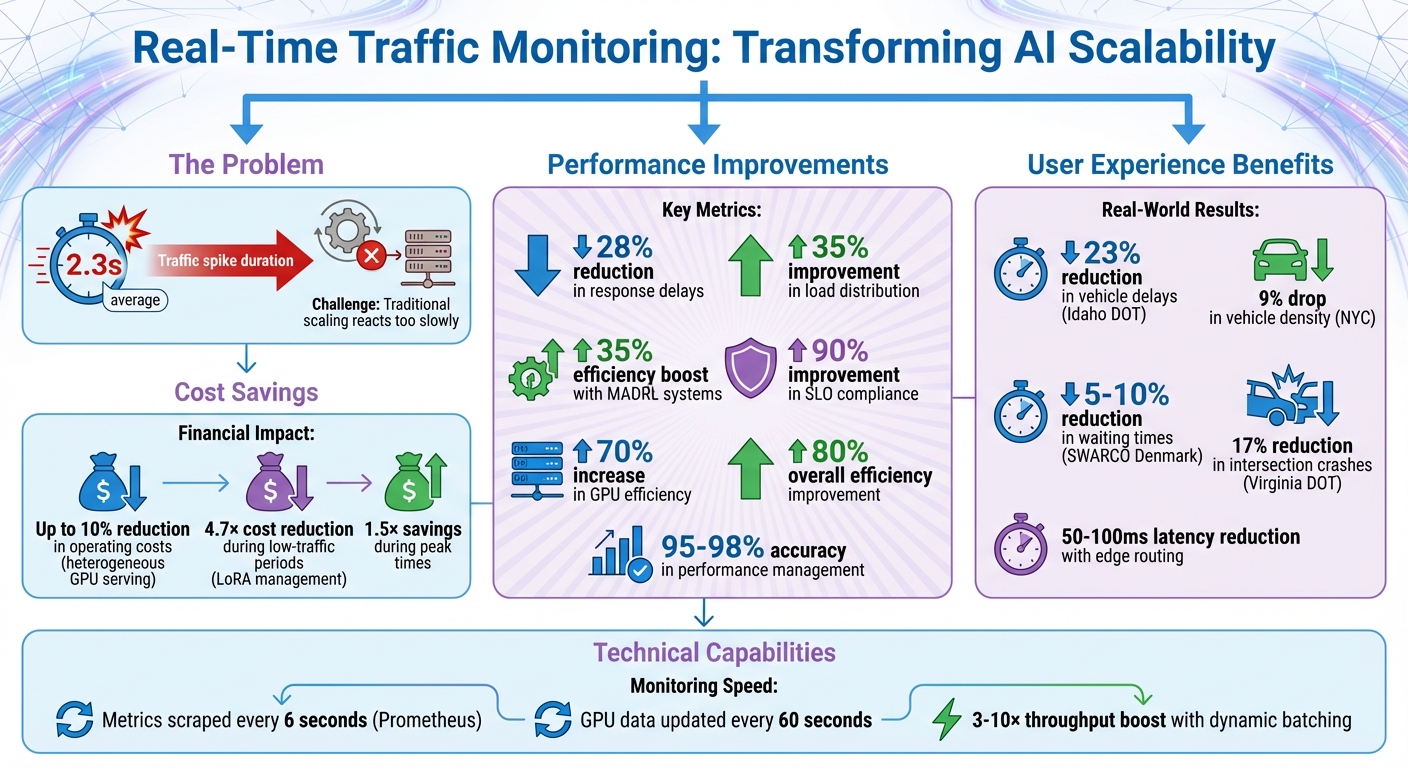
AI systems face a major challenge: sudden traffic spikes that disrupt performance. These surges, lasting an average of 2.3 seconds, can overwhelm infrastructure, causing delays and failed requests. Traditional scaling methods often react too slowly, relying on outdated metrics like GPU utilization.
Real-time traffic monitoring solves this problem by tracking live metrics - such as queue size and token throughput - and instantly adjusting resources. This approach reduces delays by 28%, improves load distribution by 35%, and ensures uninterrupted service during demand spikes. Key techniques include:
- Dynamic routing: Redirects traffic to backup resources when systems are strained.
- Predictive analytics: Anticipates future demand using historical data, avoiding delays.
- Regional distribution: Spreads workloads across multiple locations to reduce latency.
- Cost-aware scaling: Allocates resources efficiently, cutting expenses by up to 10%.
These strategies not only maintain system reliability but also optimize costs and improve user experience.
Real-Time Traffic Monitoring Benefits: Performance, Cost, and Efficiency Metrics
How load balancing AI workloads delivers faster user response times (demo)
sbb-itb-903b5f2
How Real-Time Traffic Monitoring Works
Real-time monitoring systems rely on AI gateways or adjunct modules to oversee system interactions. These gateways collect essential data points, including response times, error rates, and resource usage. Kong Inc. explains this process well:
An AI gateway acts as a central control point for all your AI interactions, giving you unprecedented visibility and control over your AI infrastructure.
A key metric analyzed is the queue-to-compute ratio, which measures waiting time against processing time. This hardware-independent measure highlights potential bottlenecks, as noted by NVIDIA. Systems also monitor HTTP error codes (429, 400, 500/503) to identify capacity issues. Some advanced systems implement the Open Request Cost Aggregation (ORCA) standard to track application-specific signals like GPU load, enabling more precise load balancing. These insights help systems make real-time adjustments that improve routing.
Capturing and Analyzing Real-Time Metrics
Monitoring platforms gather data through multiple channels. Systems such as NVIDIA Triton and Hugging Face TGI export real-time metrics that tools like Prometheus scrape at intervals as short as 6 seconds. These metrics include queue size, compute time, and token throughput - encompassing both prompt and completion tokens - to identify resource-heavy user requests.
By tracking Queries Per Second (QPS) and first-token latency, systems pinpoint which types of requests put the most strain on resources. For example, an inefficient AI inference endpoint can rack up thousands of dollars in costs within minutes due to high token processing demands. Real-time monitoring helps catch such issues early.
Semantic routing is another crucial tool. It identifies semantically similar queries and directs simpler requests to less expensive models, avoiding unnecessary computations.
Advanced systems stream logs to platforms like Azure Stream Analytics, enabling windowed operations without the delays typical of standard log ingestion. Gateways also capture full client IP addresses and custom identifiers - such as business unit IDs - for billing purposes, as native AI telemetry often obscures this data. With these metrics in place, systems can adjust traffic routing based on performance in real time.
Routing Requests Based on Performance
Using real-time insights, performance-based routing ensures scalability by dynamically directing requests. This includes performance-based routing, which shifts traffic to the fastest available model, geographic routing, which sends queries to the nearest regional data center, and cost-aware routing, which assigns lower-cost models to routine tasks while reserving high-end models for complex queries. These approaches help prevent any single instance from being overburdened.
Load balancers distribute traffic across multiple AI models or servers using algorithms like latency-aware routing and least connections. When a primary deployment hits 100% utilization, spillover management redirects excess traffic to secondary deployments.
The system tracks these spillover events via the x-ms-spillover-from header in responses, identifying requests rerouted due to saturation. To protect AI models during temporary failures, mechanisms like exponential backoff and circuit breakers are employed.
Integration with AI Management Platforms
Real-time monitoring also connects with broader AI management platforms to support large-scale operations. Prometheus adapters and Custom Metrics Stackdriver Adapter transform raw metrics from inference servers into formats usable by orchestrators like Kubernetes for scaling decisions. For example, GKE system metrics send GPU utilization data (duty cycle) to Cloud Monitoring every 60 seconds.
These platforms use capacity-based load balancing to distribute traffic according to service capacity - measured as the maximum requests per second each pod can handle. When a local cluster reaches its limit, traffic is redirected to the next closest healthy region with available capacity. Microsoft highlights the importance of centralized monitoring:
Monitoring inputs and outputs at the gateway allows you to apply auditing rules uniformly across all models.
Gateway-based auditing centralizes logging for model inputs and outputs, tracks token usage for billing, and detects threats across different model versions. In Kubernetes environments, the Horizontal Pod Autoscaler (HPA) can check custom metrics every 6 seconds, enabling rapid responses to traffic spikes. This seamless integration between monitoring systems and management platforms ensures that scaling decisions are based on current conditions rather than outdated data.
Load Balancing Techniques for Peak Demand
Auto-Scaling and Resource Allocation
Auto-scaling is all about dynamically adjusting compute resources to keep up with fluctuating demand. A tool like the Horizontal Pod Autoscaler (HPA) helps by monitoring metrics such as queue size and GPU usage. When thresholds are exceeded, it spins up new instances, and when traffic slows, it scales back down. However, for AI workloads, traditional metrics can be misleading - especially when input token lengths vary. For example, a BERT model might need up to 100 times more processing time for longer sequences.
To address this, advanced systems rely on hierarchical backpressure, which balances low-latency, interactive requests with batch processing. This approach can improve Service Level Objective (SLO) compliance by up to 90% and increase GPU efficiency by 70%. Another technique, dynamic batching, combines multiple inference requests into a single GPU operation, delivering a throughput boost of 3× to 10×.
In addition to reactive scaling, predictive analytics can prepare systems for upcoming demand spikes.
Predicting Traffic Surges with Data Analytics
Predictive analytics takes dynamic scaling a step further by forecasting future demand, helping to prevent delays before they occur. By analyzing historical data, predictive autoscaling identifies usage patterns over 3 to 21 days. Deep Neural Networks (DNNs) are often used for demand forecasting, while Reinforcement Learning (RL) adapts load distribution in real time. Multi-Agent Deep Reinforcement Learning (MADRL), for instance, can improve efficiency by 35% and cut response delays by 28%.
Google Cloud highlights the importance of balancing real-time signals with predictive models:
If the current value of a real-time signal is greater than the prediction, the current value of the signal takes priority over the prediction. As a result, MIGs that have predictive autoscaling enabled always have more availability than MIGs that don't.
When setting up predictive autoscaling, it’s crucial to account for your application’s initialization time - say 5 minutes - so new instances are ready before traffic surges.
Predictive scaling works even better when combined with regional workload distribution.
Distributing Workloads Across Regions
Geographic distribution spreads workloads across multiple data centers, reducing latency and preventing overload. For global users, routing traffic to edge locations can trim average latency by 50 to 100 milliseconds. Policies like SpotHedge strategically distribute AI model replicas across regions and clouds, minimizing the risk of spot instance interruptions while keeping costs down. For AI inference, balancing queue depth - based on the number of pending requests per GPU - outperforms traditional connection-based methods. Monitoring regional spillover events also helps fine-tune capacity planning and budget allocation.
These strategies demonstrate how real-time monitoring and smart resource management can ensure scalability and efficiency during peak demand periods.
Benefits of Real-Time Traffic Monitoring
Better Performance Metrics
Real-time monitoring plays a crucial role in maintaining smooth operations, even during high-demand situations. For instance, failover routing ensures uninterrupted service by automatically redirecting traffic when a model encounters issues. Semantic caching speeds up response times by storing answers to similar queries for quick retrieval, cutting down both latency and computational load. Meanwhile, dynamic load balancing prevents bottlenecks during traffic surges, keeping systems efficient.
The impact of such systems is evident in real-world examples. The Idaho Transportation Department reported a 23% reduction in average vehicle delays within just 12 months of using AI-based adaptive detection and signal control at busy intersections. In general, AI-driven traffic management systems have been shown to improve efficiency by as much as 80%.
Beyond performance, this level of optimization also leads to reduced operating expenses by avoiding resource waste.
Lower Operating Costs
Smart resource allocation is a game-changer for cost savings. Real-time monitoring prevents over-provisioning by scaling resources down during quieter periods, ensuring businesses don't pay for unused capacity. For example, high-density LoRA management can cut costs by up to 4.7× during low-traffic periods and still deliver 1.5× savings during peak times. Similarly, heterogeneous GPU serving - which routes tasks to the most cost-efficient hardware based on real-time data - reduces expenses by about 10% compared to relying on uniform hardware setups.
Keeping track of specific metrics, like GPU High Bandwidth Memory (HBM) usage, ensures that expensive accelerators operate at maximum efficiency, reducing the number of instances required. Additionally, gateway-based tracking allows businesses to allocate costs accurately by client or department, improving budgeting and financial planning.
Better User Experience
A smoother, faster, and more reliable experience keeps users happy. Take Uber, for example. Its real-time AI system processes billions of data points daily - factoring in ride requests, traffic conditions, and even the weather - to dynamically adjust driver availability and surge pricing. This results in shorter wait times for riders.
In Denmark, SWARCO Technology tested its SMART AI algorithm in 2024, achieving 5–10% reductions in average waiting times compared to traditional traffic control systems.
"AI systems can analyze large amounts of data from sensors, cameras, and other sources in seconds and adjust the traffic controller in real time. This results in faster reactions, less waiting time, and reduced delays for road users."
- SWARCO Technology
These improvements not only enhance the user experience but also ensure that AI-driven platforms like NanoGPT remain scalable, efficient, and responsive, delivering consistent benefits across the board.
How to Implement Real-Time Traffic Monitoring
Building a Modular System Architecture
When setting up real-time traffic monitoring, a modular system architecture is key. Using an AI Gateway simplifies traffic management by handling routing, rate limiting, and observability. It also separates authentication processes through enterprise protocols like OAuth or Managed Identities, ensuring smoother operations.
To handle regional traffic limits, consider deploying your system across multiple regions. For example, using two regions doubles your requests-per-minute (RPM) capacity. During traffic surges, implement a spillover mechanism: direct primary traffic to provisioned throughput (PTU) endpoints, while overflow traffic is routed to pay-as-you-go (PAYG) endpoints.
For orchestrating workloads, Kubernetes (K8s) is the go-to solution for managing containerized AI models. By deploying Horizontal Pod Autoscalers (HPA) and tracking metrics like queue size and batch size, you can optimize throughput and reduce latency. A dedicated observability layer is also essential. Use tools like Kafka or Azure Event Hubs to emit custom events, enabling near real-time monitoring and dashboarding.
This modular approach provides a sturdy framework for managing infrastructure and processing data effectively.
Infrastructure and Data Processing Needs
To support inference servers, leverage high-performance NVIDIA GPUs like the A10G or H100, paired with shared storage solutions such as persistent volumes or NFS (e.g., Amazon EFS).
For monitoring, include Prometheus (or its managed counterpart on Google Cloud) to collect metrics from inference servers. Prometheus can scrape Triton metrics as frequently as every 6 seconds, offering high-resolution data critical for autoscaling. Add the NVIDIA Data Center GPU Manager (DCGM) Exporter to gather hardware-level metrics, such as GPU utilization and memory usage. To make these metrics actionable, use tools like the Prometheus Adapter or Custom Metrics Stackdriver Adapter to feed custom metrics - like queue size - into Kubernetes HPA.
A notable example comes from NVIDIA's October 2024 reference architecture, which demonstrated how Triton Inference Server and TensorRT-LLM could scale large language models (LLMs) on Kubernetes. By using Prometheus and a custom "queue-to-compute ratio" metric, the system automatically scaled from 1 to 4 replicas during traffic spikes, maintaining low latency for GPT-2 models on NVIDIA A10G GPUs.
These components not only streamline monitoring and scaling but also play a big role in managing costs effectively.
Managing Costs and Budgets
Cost control starts with metric-based autoscaling. Fine-tune your HPA settings to scale only when necessary, using metrics like queue size and a 5-minute stabilization window to avoid unnecessary scaling.
To allocate costs accurately, implement gateway-based chargebacks. By tracking token usage by client IP or identity, you can assign costs to specific business units and enforce usage quotas, preventing unexpected budget spikes. Microsoft’s January 2026 update to its Azure OpenAI documentation offers a practical example. By configuring the spilloverDeploymentName property in the REST API, organizations can redirect overage traffic to pay-as-you-go deployments, ensuring consistent performance and avoiding 429 errors during traffic bursts.
You can also monitor spillover events using the IsSpillover marker to optimize pay-as-you-go usage. For platforms like NanoGPT, which operate on a pay-as-you-go model, this ensures you’re only paying for what you use, all while maintaining peak performance during demand surges.
Conclusion
Real-time monitoring transforms scalability challenges into opportunities. By focusing on key performance metrics and dynamic routing, organizations can achieve impressive results - like 95–98% accuracy in performance management and up to an 80% boost in efficiency.
The impact of AI-driven monitoring is clear when compared to older, reactive methods. For instance, the Virginia Department of Transportation implemented the InSync adaptive signal system across 13 corridors, including a 9.4-mile stretch in Fauquier County. The result? A 17% reduction in intersection crashes and shorter travel times. Likewise, New York City's 2025 AI framework analyzed over 9 million images from nearly 1,000 traffic cameras, leading to a 9% drop in weekday passenger vehicle density within the Congestion Relief Zone.
These achievements rest on a solid technical foundation. Tools like semantic caching minimize redundant model calls, spillover management ensures uninterrupted service during traffic bursts, and multi-provider strategies eliminate single points of failure. As Portia Lartey, Project Transportation Engineer at Gorove Slade, explains:
Adaptive traffic signals offer a strategic advantage as cities and state DOTs continue to embrace smart infrastructure and future-ready systems.
For pay-as-you-go platforms like NanoGPT, dynamic monitoring balances cost and performance. By charging only for actual usage, these systems maintain efficiency even during surges. Intelligent routing, automated scaling, and cost-aware spillover policies create resilient AI infrastructure that adapts seamlessly to changing conditions.
FAQs
How does real-time traffic monitoring help scale AI models?
Real-time traffic monitoring plays a key role in making AI models more scalable. By dynamically adjusting workloads based on current demand, it ensures resources are used efficiently. This prevents bottlenecks during busy times, keeping performance steady and reliable.
Analyzing traffic patterns as they happen also allows AI systems to anticipate surges. They can then adjust on the fly, which helps maintain quick response times and boosts reliability. This method not only supports scalability but also ensures that computing power is used to its fullest potential, even when demand is at its highest.
How does predictive analytics improve traffic monitoring and AI scalability?
Predictive analytics transforms traffic monitoring by spotting potential congestion, accidents, and hazardous conditions before they occur. This early detection enables preventive actions that smooth traffic flow, cut down delays, and boost safety on the roads.
By combining real-time data, predictive analytics also strengthens AI model performance. It adapts dynamically to handle heavier workloads during peak traffic times, ensuring resources are used efficiently and operations remain smooth, even during high-demand periods.
How does cost-aware scaling reduce expenses during high traffic periods?
Cost-aware scaling focuses on cutting expenses by adjusting computing resources in real-time based on demand. It ensures that extra capacity is added only when it's truly needed, avoiding unnecessary spending during traffic surges.
By increasing resources during busy periods and reducing them during slower times, businesses can make better use of their resources without compromising performance. This strategy keeps costs under control while delivering a smooth user experience, even during peak demand.