
How Serialization Cuts AI Response Time
AI replies can slow down before the model does any work. In many systems, the main drag starts with request packaging, parsing, transport, and queueing across the client, gateway, broker, and worker.
Here’s the short version: if you want lower response time, I’d start by shrinking payloads, cutting repeat encode/decode steps, streaming text output, and sending image references instead of Base64 blobs. The article shows why this matters: serialization work can take up to 50% of microservice runtime, a 100 KB payload can cost about 8 ms to move over a 100 Mbps link, and a 2 MB payload can cost about 160 ms before app work begins.
What I’d keep in mind:
- Every hop adds delay: client → gateway → broker → worker → model → response
- Large payloads hurt p95 and p99 more than averages
- JSON is easy at the edge, but binary formats like Protobuf or MessagePack are often better for internal hops
- Deep JSON, repeated chat history, and tool schemas add extra bytes and parse time
- Base64 images add about 33.3% size overhead
- Streaming helps time to first token, even when total generation time stays close
If I had to boil the whole piece down to one idea, it would be this: payload shape matters as much as model speed.
Quick Comparison
| Area | Slower pattern | Faster pattern | Why it matters |
|---|---|---|---|
| Text input | Full chat history on every turn | Short context + IDs where possible | Fewer bytes, less parsing |
| JSON structure | Deep nesting, embedded JSON strings | Flat schema | Less server-side encode/decode work |
| Image input | Base64 inline image | URL, object key, or upload token | Much smaller request body |
| Internal transport | JSON across all hops | Binary format for internal hops | Smaller messages, less CPU work |
| Output | Wait for full response | Stream first tokens early | Lower perceived wait time |
So if you’re looking at slow AI responses, I wouldn’t check only model inference. I’d look at the bytes moving through the pipeline first.
sbb-itb-903b5f2
Where serialization adds delay in AI pipelines
Once a request leaves the client, delay usually comes from three places: conversion, transport, and queueing.
Encoding costs at the client, gateway, and worker
Every hop adds work before inference even begins. The client serializes the request, the gateway parses and serializes it again, and the worker decodes it for the model runtime.
That may sound small on paper. But it stacks up fast.
For a 1 KB message, JSON serialization and deserialization takes about 13.9 μs, Protobuf about 4.2 μs, and Cap'n Proto about 0.7 μs. When those conversions happen again and again across a pipeline, they can add 12–23 ms before inference starts.
Broker I/O, queueing, and network transfer
Brokers like Kafka and RabbitMQ treat each message as an opaque byte payload. In plain English, they don't care what the message means. They just move bytes around.
That makes payload size a big deal. More bytes mean more disk, memory, and network work. Bigger payloads also spend more time sitting in broker queues and more time moving across the network. So what starts as a serialization choice turns into response-time delay.
At 100 Mbps of effective throughput, a 100 KB JSON payload takes about 8 ms to transfer over the network. A 2 MB payload can take about 160 ms - and that's before any application-level work starts. In many cases, CPU serialization time is smaller than network and broker I/O.
That is why payload shape matters more than raw request count.
Why payload size raises p95 latency more than average latency
Big payloads don't slow down every request the same way. They hit the slowest requests the hardest.
When a large message shows up, it holds CPU, network, disk, and queue slots for longer. That slows the requests behind it. This is head-of-line blocking: a small request gets stuck waiting behind a large one.
The result is a longer latency tail. Median latency may look stable, but p95 and p99 can jump during peak load because large messages keep queue and broker resources busy for longer. In practice, doubling median payload size can push p95 latency up by 2–3x during peak load, while average latency goes up by a much smaller amount.
For image generation workloads, the largest 5%–10% of payloads tend to account for a disproportionate share of timeouts and SLA misses.
The next issue is which payload shapes create those large tails.
Payload patterns that slow text and image workloads
The biggest serialization hits usually come from payloads that send too much state or stuff large binaries into the request.
Text requests with repeated context and deeply nested JSON
Stateless chat APIs send the full conversation history on every turn. In practice, that means prompts often include stale messages, unused tool definitions, and extra serialization work. Every extra field gets copied, parsed, and queued again at each hop.
Tool definitions can pile on fast. Each tool schema adds roughly 50–100 tokens to a request, and five tools can add about 250–500 tokens of overhead per call. That extra context turns into latency you can feel.
Deeply nested JSON adds more drag. Nested arrays, objects, and embedded JSON strings increase traversal, validation, and copy work before the request even moves forward. Benchmarks show that deeply nested payloads can add 10–30 ms of server-side serialization delay and increase payload size by 20–50% compared with flatter structures. Flattening those models can cut serialization time by 50–70% and reduce payload size by 30–60%.
You can think of it like shipping a small item in three boxes instead of one. Same item, more handling.
That same pattern shows up in image pipelines too, where inline binaries and bulky metadata make every hop heavier.
Image requests with inlined files and large metadata blocks
In image workflows, one of the costliest habits is embedding image data directly in the request body as Base64. Base64 adds about 33.3% size overhead. So a 5 MB image turns into about 6.67 MB before quoting or escaping. That extra data has to pass through every layer: the API gateway, the broker, and the worker.
A better path is to send a file reference, object-storage key, or upload token instead of the raw binary. That keeps the payload small and cheaper to serialize, while the worker fetches the image only when it needs it.
Large metadata blocks create the same kind of slowdown. Detailed EXIF data, transformation histories, or long annotations attached to every image message add bytes that must be sent and parsed, even when they don't help the model produce output.
Lean payload vs. bloated payload: a side-by-side comparison
The gap between a lean payload and a bloated one is pretty clear:
| Dimension | Lean payload | Bloated payload |
|---|---|---|
| Text request size | Last 2–3 turns + compact system prompt | Full 20-turn history + oversized prompt + all tool schemas |
| Image request size | File reference / storage key | Base64-encoded image inline (~33% larger) |
| JSON structure | Flat schema, short field names | Deeply nested objects, embedded JSON strings |
| Broker throughput | Higher; smaller messages move faster | Lower; large messages take longer to move through the system |
| p95 latency | More stable under peak load | More likely to spike during congestion |
These are the payload shapes that gain the most from smaller schemas, fewer passes, and external media references.
How brokers and protocols handle serialized AI messages
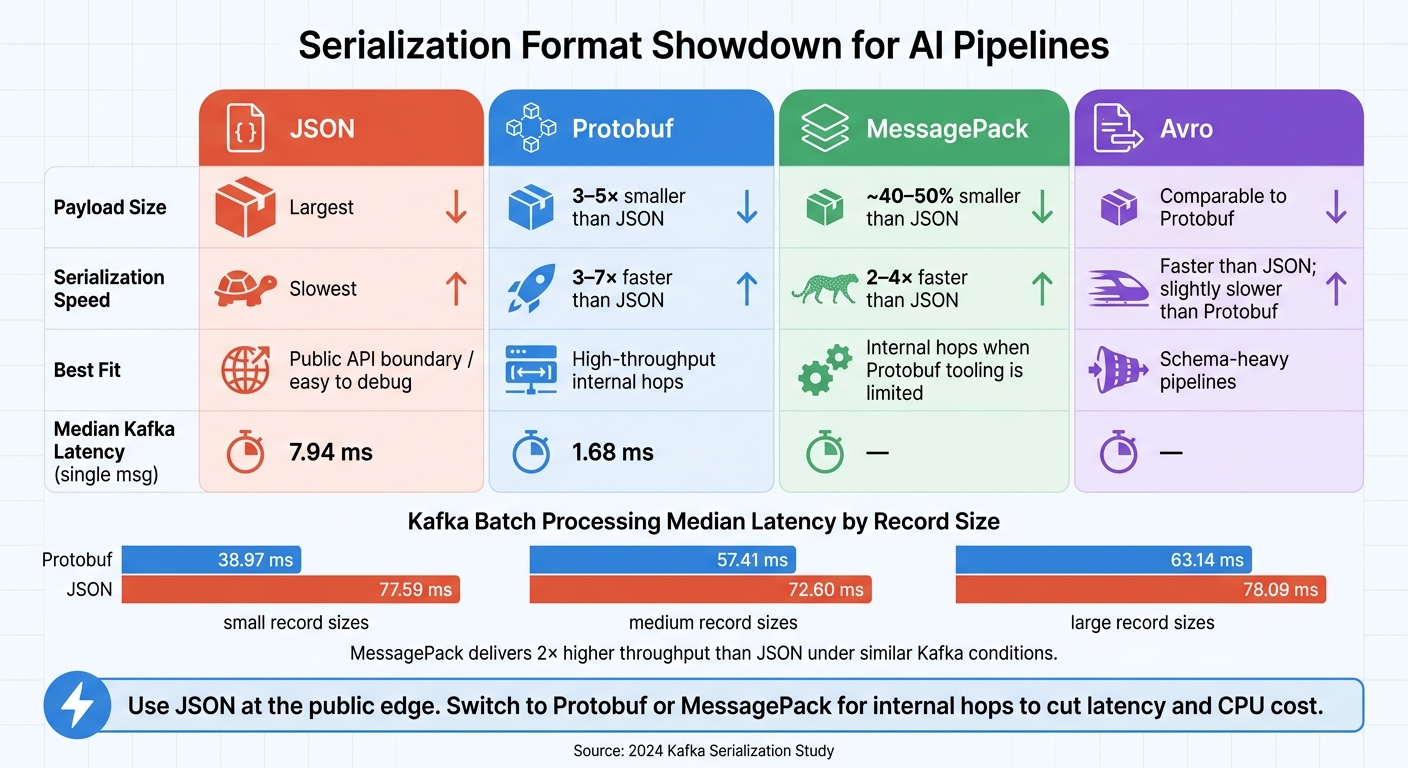
Serialization Formats Compared: JSON vs Protobuf vs MessagePack vs Avro
What brokers actually do with serialized payloads
Once a serialized AI request hits a message broker - whether that’s Kafka, RabbitMQ, or NATS - the broker treats the message body as opaque bytes. It enqueues, replicates, and routes those bytes. The encoding step happens before publish, and decoding happens after consume.
That design keeps brokers lean. But message size still has a big effect on performance. Larger payloads take more time to write, replicate, and move through the system. Under load, that pushes up p95 and p99 latency.
So yes, the serialization format is a direct latency lever.
JSON over HTTP vs. binary formats for internal hops
JSON over HTTP is a good fit at the public edge. It’s easy to work with, easy to inspect, and widely supported.
Inside the pipeline, though, JSON starts to drag. Its text format makes payloads bigger, and parsing it burns CPU - especially when you’re dealing with long prompts, tool outputs, or nested metadata. A common pattern is simple: accept JSON at the gateway, then convert it to a binary format for internal hops. You keep outside compatibility without carrying extra weight on the hot path.
At that point, the practical question becomes: which format adds the least overhead inside the system?
Serialization format comparison table
A 2024 Kafka study found clear latency gaps across formats. In single-message tests, Protobuf posted a median latency of 1.68 ms for the smallest payload size, versus 7.94 ms for JSON.
Batch processing showed the same pattern. Protobuf had the lowest median latencies at about 38.97 ms, 57.41 ms, and 63.14 ms as record sizes increased. JSON, by comparison, came in at 77.59 ms, 72.60 ms, and 78.09 ms. MessagePack also performed well, delivering 2× higher throughput than JSON under similar Kafka conditions.
| Format | Payload size | Serialization speed | Best fit |
|---|---|---|---|
| JSON | Largest | Slowest | Public API boundary; easy to debug |
| Protobuf | 3–5× smaller than JSON | 3–7× faster than JSON | High-throughput internal hops |
| Avro | Comparable to Protobuf | Faster than JSON; slightly slower than Protobuf | Schema-heavy pipelines |
| MessagePack | About 40–50% smaller than JSON | 2–4× faster than JSON | Internal hops when Protobuf tooling is limited |
These differences show up most when payloads are large, nested, or repackaged again and again between hops.
Changes that reduce response time for text and image tasks
Use smaller schemas, fewer fields, and fewer re-encodes
Once you know where the delays are, the fixes are pretty simple: trim payloads first. Cut work at the client, gateway, broker, and worker.
A good place to start is the request and response shape. If a field isn't used, remove it. That alone has been shown to cut encoding time by about 12% and shrink network payload size by about 25%. It also helps to flatten deep JSON into simpler, flat structures.
The next issue is repeated encoding. If the same data gets serialized again and again as it moves through your stack, you're burning time for no good reason. A better approach is to use one internal message format: serialize once at ingress, then pass those bytes through brokers as-is.
And when some data shows up in many requests - like a standard system prompt or default model settings - cache a pre-serialized blob. That way, workers can reuse it instead of serializing the same thing on every call.
Stream text early and send references for large media
For output-heavy tasks, two changes tend to matter most.
For chat and writing, streaming improves time to first token. Users see output sooner, which makes the system feel faster even if total model time doesn't change. In practice, streaming can cut perceived latency by 30–50%.
For image and multimodal work, the closest equivalent is sending references instead of inlining files. A base64-encoded image can add hundreds of kilobytes - or even several megabytes - to one request. Replacing that with a URL or object ID can shrink the payload by an order of magnitude.
That matters because smaller messages move through brokers faster. They're also easier to buffer and route.
Conclusion: The changes that help most, in order
Serialization delay adds up at every hop - client, gateway, broker, and worker. Payload size is a big driver of both network cost and tail latency.
Start here:
- Lean payloads first: flatten schemas, drop unused fields, and replace repeated context with short identifiers.
- References over embedded media: swap inlined images for URLs or object IDs to cut broker load and transfer time.
- Streaming for text: use chunked responses so users see output early.
- Efficient internal formats: move to Protobuf, MessagePack, or another binary format for internal hops to stack the gains from smaller payloads.
Track p95 and p99, and audit payloads on a regular basis.
FAQs
How can I tell if serialization is causing AI latency?
Isolate the data pipeline from model inference. A simple way to test this is to swap your dataset for random tensors. If throughput roughly doubles, the slowdown is probably coming from the pipeline, not the model.
It also helps to watch for a few common signs:
- High CPU usage while the GPU sits idle or underfed
- Too many workers for small or tabular datasets
- Delays in distributed tracing during data handling or data transfer, instead of during inference
That pattern usually tells you the model isn’t the thing holding you back.
When should I switch from JSON to a binary format?
Switch when you need higher throughput or less data overhead. Binary formats like MessagePack, Avro, and Protobuf strip out much of JSON’s extra text, which often cuts payload size by 30 to 50 percent.
MessagePack is a good fit for high-throughput internal APIs. Avro and Protobuf make sense for schema-driven streaming pipelines. Another plus: binary formats avoid Base64 overhead for binary data, which can make JSON payloads about 33 percent larger.
What is the fastest way to reduce payload size?
The fastest path is to tighten up prompt engineering and token management.
Short, specific prompts can cut token use by up to 50%. If you also limit output length, you shrink the amount of data being processed and sent back, which lowers compute load too.
You can also use semantic compression or token pruning to reduce token counts by 20% to 40%. On the transfer side, data compression often saves more time in transit than it takes to compress and decompress the payload.