Supervised Learning for Churn: A Beginner's Guide
Churn prediction helps businesses prevent revenue loss by identifying customers likely to leave. Supervised learning is a powerful method for this, using historical data to predict churn and enable timely interventions. Here's a quick breakdown:
- What is churn? It includes voluntary (customer chooses to leave), involuntary (payment issues), partial (downgrades), and silent churn (disengagement without cancellation).
- How does supervised learning help? Models analyze data like usage, payments, and support interactions to classify customers as "Churn" or "No Churn."
- Steps to build a churn model:
- Collect historical data (e.g., demographics, usage patterns).
- Preprocess data (e.g., handle missing values, encode variables).
- Train models (e.g., Logistic Regression, Random Forest, XGBoost).
- Evaluate using metrics like recall, precision, and F1-score.
- Tools to use: Scikit-learn, PyCaret, and Imbalanced-learn for data processing and modeling.
Supervised learning transforms churn management into a proactive strategy, allowing businesses to act before customers leave. By using the right tools and techniques, you can build effective models to improve retention and revenue.
4-Step Process to Build a Churn Prediction Model Using Supervised Learning
Customer Churn Prediction with Machine Learning | ML FinTech Project for Beginners
sbb-itb-903b5f2
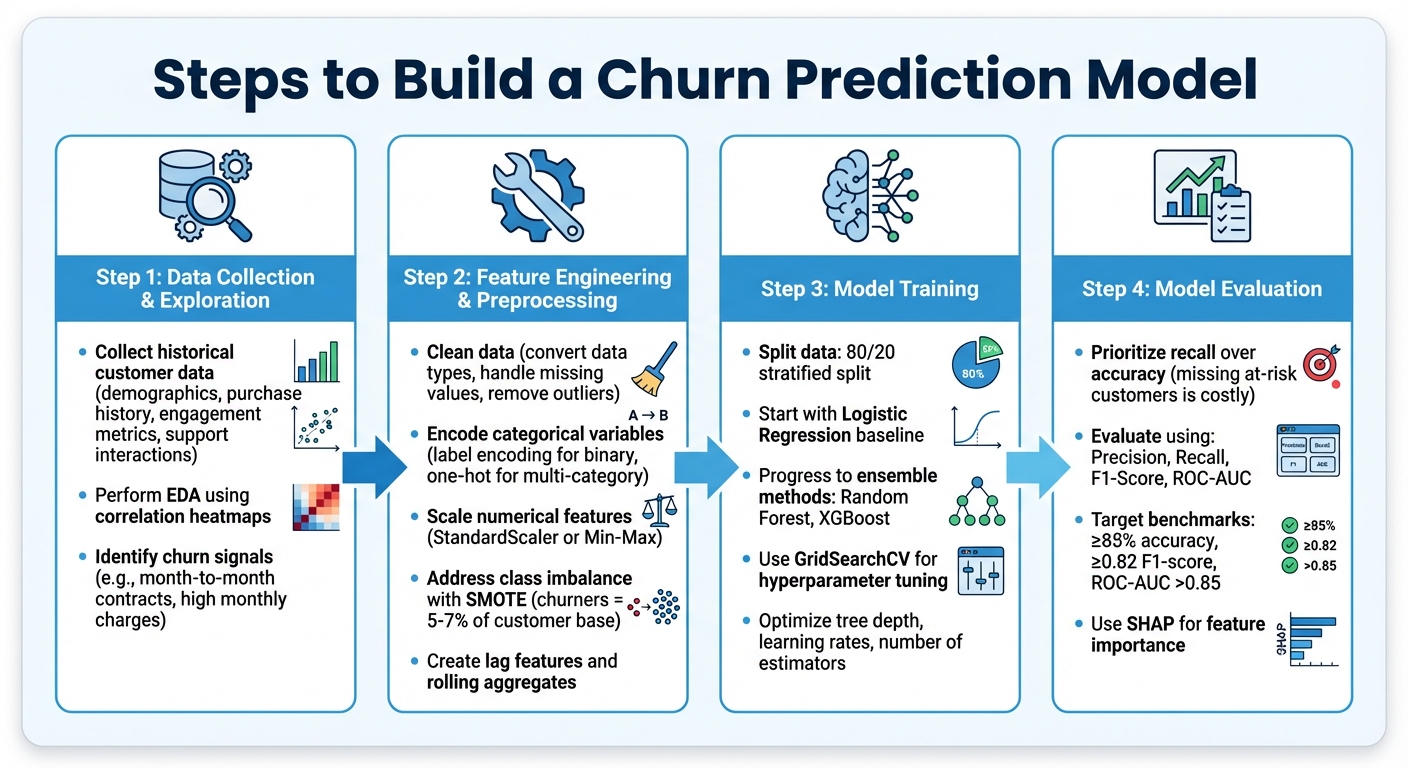
Steps to Build a Churn Prediction Model
To create a churn prediction model, you’ll need to gather historical customer data, process it for analysis, and train a model capable of identifying customers who are likely to leave.
Data Collection and Exploration
The process starts by collecting historical customer data. This includes details like demographics, purchase history, engagement metrics, and support interactions.
Next, dive into Exploratory Data Analysis (EDA) to uncover patterns that often signal churn. For instance, correlation heatmaps can highlight features - such as contract type, monthly charges, or support ticket frequency - that are closely tied to churn. You might notice, for example, that customers with month-to-month contracts and higher monthly charges are more prone to churn. These insights help pinpoint which features to focus on when building your model.
Feature Engineering and Preprocessing
Before training your model, the raw data needs to be cleaned and prepped. This includes converting data types (like changing TotalCharges from text to numeric), filling in missing values, and removing outliers.
Categorical variables should be encoded properly - use label encoding for binary categories and one-hot encoding for multi-category variables. For numerical features, apply scaling methods like StandardScaler or Min-Max Scaling to ensure consistent ranges.
Feature engineering can significantly boost prediction accuracy. For example, creating lag features (e.g., days since the last login) or rolling aggregates (e.g., total purchases in the last six months) can provide better insights than raw timestamps. Another key step is addressing class imbalance. Since churners often represent just 5–7% of the customer base, techniques like SMOTE can help balance the dataset. This ensures your model doesn’t default to predicting "no churn" for most cases. With these adjustments, your data will be primed for effective supervised learning.
Model Training and Evaluation
Split your dataset into training and testing sets using a stratified 80/20 split, ensuring the churn-to-retention ratio remains consistent in both sets. Begin with a simple model like Logistic Regression as a baseline, then explore more advanced ensemble methods like Random Forest or XGBoost.
Fine-tune your model’s performance using hyperparameter optimization tools like GridSearchCV. Focus on parameters such as tree depth, learning rates, and the number of estimators. While accuracy matters, recall often takes priority in churn prediction. Missing an at-risk customer can be far more costly than mistakenly flagging a loyal one. Use metrics like precision, recall, F1-score, and ROC-AUC to evaluate your model’s ability to differentiate between churners and non-churners.
For example, in 2023, Spotify’s engineering team applied similar strategies by analyzing user listening habits and time-of-day usage. Their model flagged at-risk premium subscribers, and by sending AI-personalized re-engagement emails, they successfully reduced churn by 21%.
Common Supervised Learning Algorithms for Churn Prediction
Once your data is prepped, the next step is selecting the right algorithm. Your choice will depend on factors like dataset size, complexity, and specific business needs. Below is an overview of some key supervised learning algorithms and their strengths when it comes to churn prediction.
Logistic Regression
Logistic Regression is often the starting point for churn prediction models. It uses a sigmoid function to estimate the probability of churn, outputting a value between 0 and 1. One of its biggest advantages is its transparency - it clearly shows how features like monthly charges or contract type influence the likelihood of churn. Plus, it's fast, typically training in under 10 seconds, making it ideal for establishing a baseline.
As data scientist Shafinmahmud explains, "A model's value isn't just in predicting churn - it's in guiding why and who is likely to churn, so the business can act early".
Decision Trees and Random Forests
Tree-based models take things a step further by offering a more visual and flexible approach. Decision Trees create a hierarchical structure to identify the strongest churn factors, using metrics like Information Gain or Gini Impurity. However, they can overfit easily unless pruned carefully.
Random Forests address this issue by combining multiple decision trees through a process called bagging (random sampling with replacement). Each tree contributes a "vote" to the final prediction, significantly reducing overfitting. In retail banking studies, Random Forests have achieved impressive results, with mean AUC scores reaching 0.993.
| Model | Interpretability | Training Speed | Best For |
|---|---|---|---|
| Logistic Regression | High | Very Fast | Establishing a baseline and explaining feature impact |
| Decision Tree | High | Fast | Visualizing decision paths for stakeholders |
| Random Forest | Medium | Moderate | Handling complex datasets with non-linear patterns |
| XGBoost | Low | Slow | Maximizing accuracy in structured data |
Support Vector Machines and Advanced Models
For more nuanced pattern recognition, advanced models like Support Vector Machines (SVM) can be effective. SVMs find an optimal hyperplane to separate churners from non-churners, even in high-dimensional spaces. After tuning, SVMs have been shown to improve recall rates from 80% to 96%. However, they tend to require more computational resources than simpler models.
Gradient Boosting Machines (GBMs), including XGBoost, LightGBM, and CatBoost, are also popular for churn prediction. These models build trees sequentially, with each tree correcting the errors of the previous one. In a retail banking study, GBMs achieved an accuracy of 87.2% and an AUC-ROC of 0.91, outperforming other models. Each variant has its own strengths: XGBoost includes regularization to prevent overfitting, LightGBM uses a leaf-wise growth strategy to speed up training on large datasets, and CatBoost is optimized for categorical data like subscription types without requiring manual encoding. A tuned XGBoost model even reached an F1 score of 84% by applying SMOTE oversampling to address class imbalance.
These algorithms are foundational to many churn prediction workflows and integrate seamlessly with libraries like Scikit-learn, making them practical choices for AI-driven solutions.
Tools and Frameworks for Churn Prediction
Once your data is ready and you've selected your algorithms, the next step is picking the right tools to build and implement your churn prediction model. Thankfully, there are plenty of affordable, open-source options that make supervised learning accessible - even when working with sensitive customer data.
Using Scikit-learn for Churn Prediction
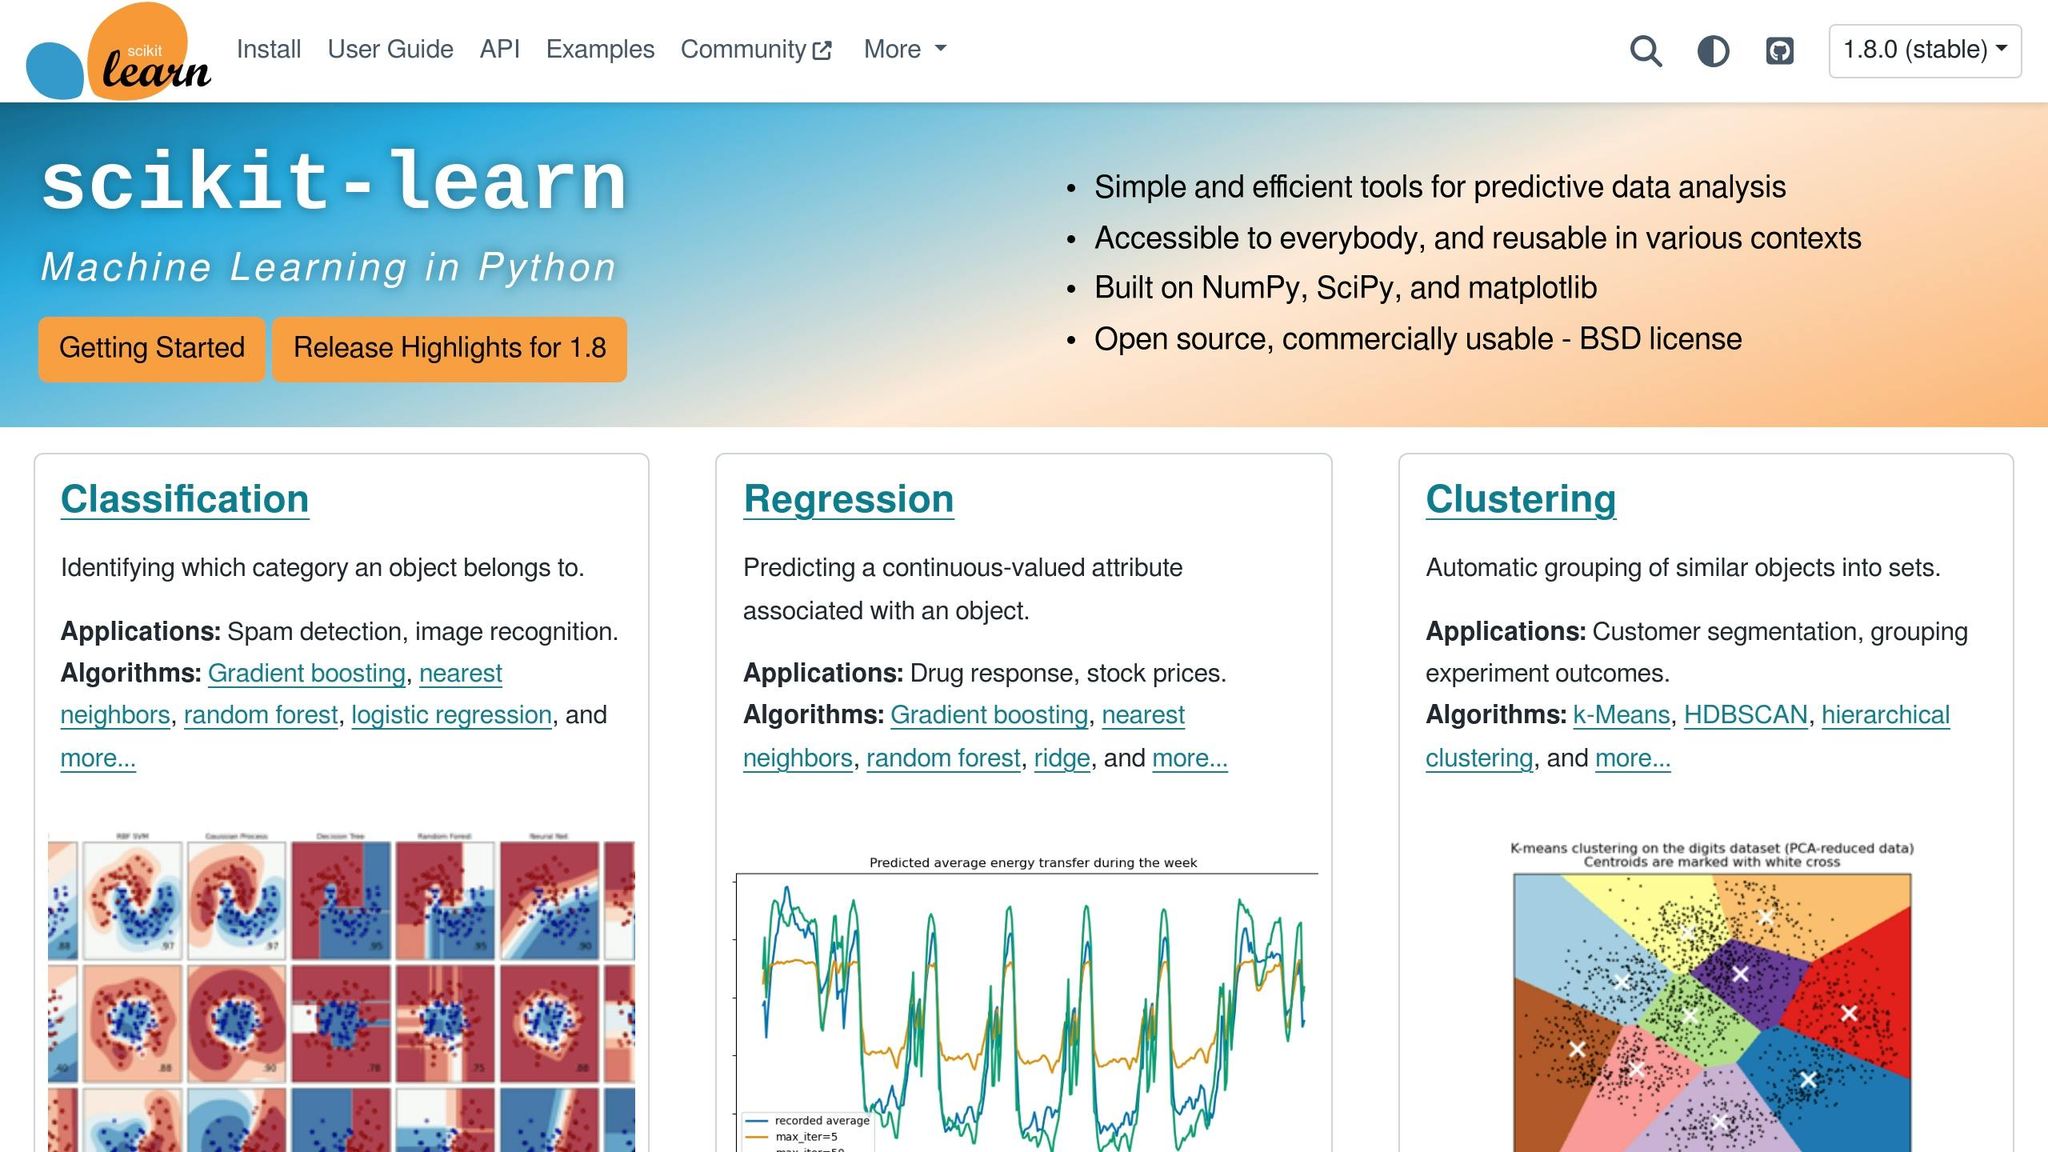
Scikit-learn is a widely-used Python library that’s perfect for those starting out with churn prediction. It’s free, BSD-licensed, and known for being beginner-friendly, with a fast learning curve. The library comes packed with everything you need: tools for data preprocessing (like LabelEncoder and StandardScaler), a variety of algorithms (such as Logistic Regression, Random Forests, and SVM), and evaluation metrics like Precision, Recall, and ROC-AUC.
For example, a baseline Logistic Regression model built with Scikit-learn can achieve around 0.85 accuracy on churn datasets. However, churn datasets often have an imbalanced class distribution - about 27% of customers typically churn. To address this, you can pair Scikit-learn with libraries like Imbalanced-learn, which provides techniques such as SMOTE to handle these imbalances.
If you're looking for an even simpler option, check out PyCaret. This open-source library automates the entire machine learning process, allowing you to compare multiple models (e.g., Gradient Boosting, Naive Bayes, Random Forest) with just one line of code. In one demonstration, a Gradient Boosting Classifier built with PyCaret achieved an AUC of 0.8472 using 10-fold cross-validation. PyCaret also supports custom business metrics, showing how a model with slightly lower AUC could still generate $400,000 more in profit by better managing false positives and negatives.
| Tool | Primary Benefit | Skill Level | Cost |
|---|---|---|---|
| Scikit-learn | Comprehensive tools with strong documentation | Beginner to Intermediate | Free |
| PyCaret | Low-code, automates model comparison | Absolute Beginner | Free |
| Imbalanced-learn | Focused on handling imbalanced datasets (e.g., SMOTE) | Intermediate | Free |
| Pandas/NumPy | Essential for data cleaning and preparation | Beginner | Free |
While Scikit-learn is great for handling numerical data, tools like NanoGPT can take your analysis further by processing text and image-based customer feedback.
How NanoGPT Supports AI-Powered Solutions
For analyzing qualitative customer feedback, NanoGPT steps in where traditional machine learning tools leave off. While libraries like Scikit-learn are ideal for structured, numerical data, NanoGPT excels at handling unstructured inputs like text and images. It provides access to several AI models - such as ChatGPT, Deepseek, and Gemini - on a pay-as-you-go basis starting at just $0.10 [nano-gpt.com].
What makes NanoGPT stand out is its privacy-first approach. All data is stored locally on your device, which is critical when working with sensitive customer information. Plus, by charging only for what you use and avoiding subscription fees, it’s a cost-effective option for experimenting with AI-powered analysis. Whether you’re summarizing customer complaints, categorizing support tickets, or identifying patterns in feedback that could indicate churn risk, NanoGPT can seamlessly integrate into your churn prediction workflow.
Conclusion
Summary of the Workflow and Algorithms
Creating a churn prediction model involves a structured process. Start by defining churn as a binary target - 1 for churn and 0 for active customers. Next, gather and prepare your data by addressing missing values, encoding categorical variables, and engineering features that reflect customer behavior. These steps are critical for improving model accuracy. Finally, train your model while considering class imbalances in the dataset.
The choice of algorithm depends on your objectives. Logistic Regression is a solid starting point due to its speed, simplicity, and interpretability - it helps identify the factors influencing churn. For uncovering complex patterns, algorithms like Random Forests and XGBoost are better suited, as they excel at capturing non-linear relationships in data. As Sree, a Data Scientist, aptly puts it:
"Your model is only as good as your data".
The importance of preprocessing and feature engineering cannot be overstated - they form the backbone of an effective churn prediction model. By following these steps, you're well-equipped to build and refine your model.
Getting Started with Your First Model
To put this into practice, consider starting with the IBM Telco Customer Churn dataset available on Kaggle. It's a widely used resource for honing churn prediction techniques. Tools like Jupyter Notebooks or Google Colab, combined with libraries such as Pandas and Scikit-learn, are excellent for building your model. Use Matplotlib or Seaborn for creating insightful visualizations.
When evaluating your model, focus on metrics like Recall and F1-Score, which are particularly relevant for imbalanced churn data. Aim for benchmarks such as ≥85% accuracy, ≥0.82 F1-score for churn, and a ROC-AUC score above 0.85. However, remember to align your optimization efforts with business objectives. For instance, in one case study, a model with slightly lower AUC but optimized for profit resulted in an additional $400,000 in gains.
Leverage Scikit-learn Pipelines to streamline preprocessing and ensure consistency as you move toward deployment. Once you've generated predictions, tools like SHAP can help you identify the key features driving churn. This step not only enhances model transparency but also transforms insights into actionable strategies for improving customer retention. By following these methods, you're setting the stage for a successful transition from concept to production.
FAQs
How do I choose the right churn definition for my business?
To figure out what churn means for your business, start by pinpointing the kind of customer attrition you're dealing with - this could be subscription cancellations, long periods of inactivity, or something else entirely. Pay attention to details like how long customers remain inactive (e.g., 30 or 90 days), behavioral patterns, and how much revenue is being affected. Your definition should match how your product is used. Also, make sure to separate voluntary churn (when customers actively cancel) from involuntary churn (like payment failures). This distinction can help you refine your predictions and retention strategies.
What churn probability threshold should I use to trigger outreach?
When it comes to setting a churn probability threshold for outreach, there’s no one-size-fits-all solution. The right cutoff depends heavily on your specific business needs, your comfort level with risk, and how well your model performs. To find the sweet spot, dig into your model’s results and weigh the trade-offs between false positives (flagging customers who wouldn’t churn) and false negatives (missing customers who do churn). Test out different thresholds, evaluate how they affect retention efforts, and settle on one that matches your objectives and the resources you have available.
How can I confidently explain churn predictions to stakeholders?
To make churn predictions understandable and useful, prioritize clarity and practical insights. Leverage explainable AI (XAI) tools like SHAP or LIME to go beyond just presenting a churn score. For instance, pinpoint specific patterns such as a noticeable drop in logins or a decline in purchase frequency. Connecting these predictions to tangible outcomes helps build trust, ensures openness, and equips stakeholders to make precise, informed decisions.