Ultimate Guide to Real-Time Pipeline Debugging
Real-time pipelines process data continuously with minimal latency, making them vital for fraud detection, AI-driven applications, and more. However, debugging these systems is challenging due to their complexity, distributed nature, and non-deterministic bugs. This guide simplifies the process with actionable insights into common failure modes, debugging techniques, and monitoring strategies.
Key takeaways:
- Real-time pipeline challenges: Observer effects, non-deterministic bugs, and distributed failures complicate debugging.
- Common issues: Poison pills, schema mismatches, state bloat, and IAM permission errors can silently disrupt pipelines.
- Tools and strategies: Dead Letter Queues (DLQs), heartbeat records, detailed telemetry, and observability tools like Flink Dashboard or OpenTelemetry are essential.
- Metrics to monitor: Consumer lag, checkpoint health, throughput, and state size are critical for identifying issues early.
- Debugging AI pipelines: AI adds complexity with plausible errors and latency requirements, necessitating privacy-aware debugging and synthetic probes.
- Best practices: Use staging environments, structured logs, and parallel pipelines to minimize downtime.
This guide provides clear, practical steps to maintain and debug real-time pipelines effectively, ensuring seamless data processing and system reliability.
Core Debugging Practices
How Real-Time Pipeline Architecture Works
To troubleshoot real-time pipelines effectively, you need to understand how their architecture is structured. Every pipeline operates through three main layers:
- Source nodes: These bring in raw data from systems like Apache Kafka or Google Cloud Pub/Sub.
- Transformation nodes: This is where business logic is applied - data gets filtered, enriched, and reshaped.
- Destination nodes (or sinks): These write the processed data to storage systems like BigQuery, RocksDB, or S3.
Connecting these layers is the transport and schema layer, which is crucial for resolving data inconsistencies. For example, Apache Kafka ensures durable, distributed message delivery, while tools like Debezium use Change Data Capture (CDC) to stream database changes as events. A Schema Registry, on the other hand, ensures that data producers and consumers remain in sync on formats like Avro or Protobuf, even as those formats evolve.
When it comes to processing, frameworks like Apache Flink, ksqlDB, and RisingWave handle complex operations, such as windowed aggregations and multi-stream joins. Before deploying any streaming query, running an EXPLAIN command can help you spot potential issues, such as high-cardinality joins or unnecessary data shuffles (StreamExchange), which could lead to performance bottlenecks.
With a solid understanding of these layers and how data flows through them, you can better tackle the common failure modes that pipelines encounter.
Common Pipeline Failure Modes
The trickiest pipeline failures aren’t the ones that crash everything - they’re the subtle ones that keep the pipeline running but stall progress.
"In stream processing, pipelines rarely fail loudly; instead, they stall." - Ashok Bhuvanagiri
Take the "poison pill" record as an example. This happens when a single malformed event triggers infinite retry loops, freezing the data watermark and starving downstream systems. For instance, Google Cloud Pub/Sub has a default 10-second acknowledgment deadline. If processing a record exceeds this time, it gets redelivered, potentially creating an endless loop.
Other common issues include:
- Schema evolution mismatches: Adding a new field upstream can break downstream sinks.
- State bloat: High-cardinality joins can accumulate excessive data, leading to
OutOfMemoryError. - IAM permission denials: These can cause silent data loss, with no visible errors.
Here’s a quick reference table to map these failures to their symptoms and solutions:
| Failure Mode | Primary Symptom | Recommended Fix |
|---|---|---|
| Poison Pill | Stalled watermark / infinite retries | Route failed records via DLQ |
| Ack Deadline Mismatch | Growing backlog / redelivery loop | Tune Ack deadlines or scale worker capacity |
| Schema Evolution | INVALID_ARGUMENT errors at sink |
Enable ALLOW_FIELD_ADDITION or equivalent |
| State Bloat | OutOfMemoryError |
Use time-windowed joins or lower-cardinality keys |
| IAM Denials | Silent failure / no data flow | Verify worker service account permissions |
"A streaming pipeline must never halt due to a bad record; it should route the failure and continue." - Ashok Bhuvanagiri
For poison pills, a Dead Letter Queue (DLQ) is the go-to solution. Use try-catch blocks in your transformation logic to send failed records to a secondary Kafka topic or a GCS bucket. This preserves the original payload and stack trace for later analysis.
Setting Up a Debugging-Ready Environment
Debugging becomes much easier when your environment is set up with proper instrumentation. Without it, troubleshooting is like trying to fix a car without any diagnostic tools.
Start by enabling detailed telemetry from the beginning - this includes error streams, audit logs, and trigger streams. These provide access to stack traces and node-level failure data when things go wrong. Pair this with centralized log aggregation tools like OpenObserve and use Prometheus for tracking metrics.
There are two essential debugging tools every pipeline should have:
- Heartbeat records: These are synthetic events injected periodically into the source topic. They help measure end-to-end latency across the pipeline.
- Dead Letter Queues (DLQs): These ensure that a single problematic record doesn’t bring the entire pipeline to a halt.
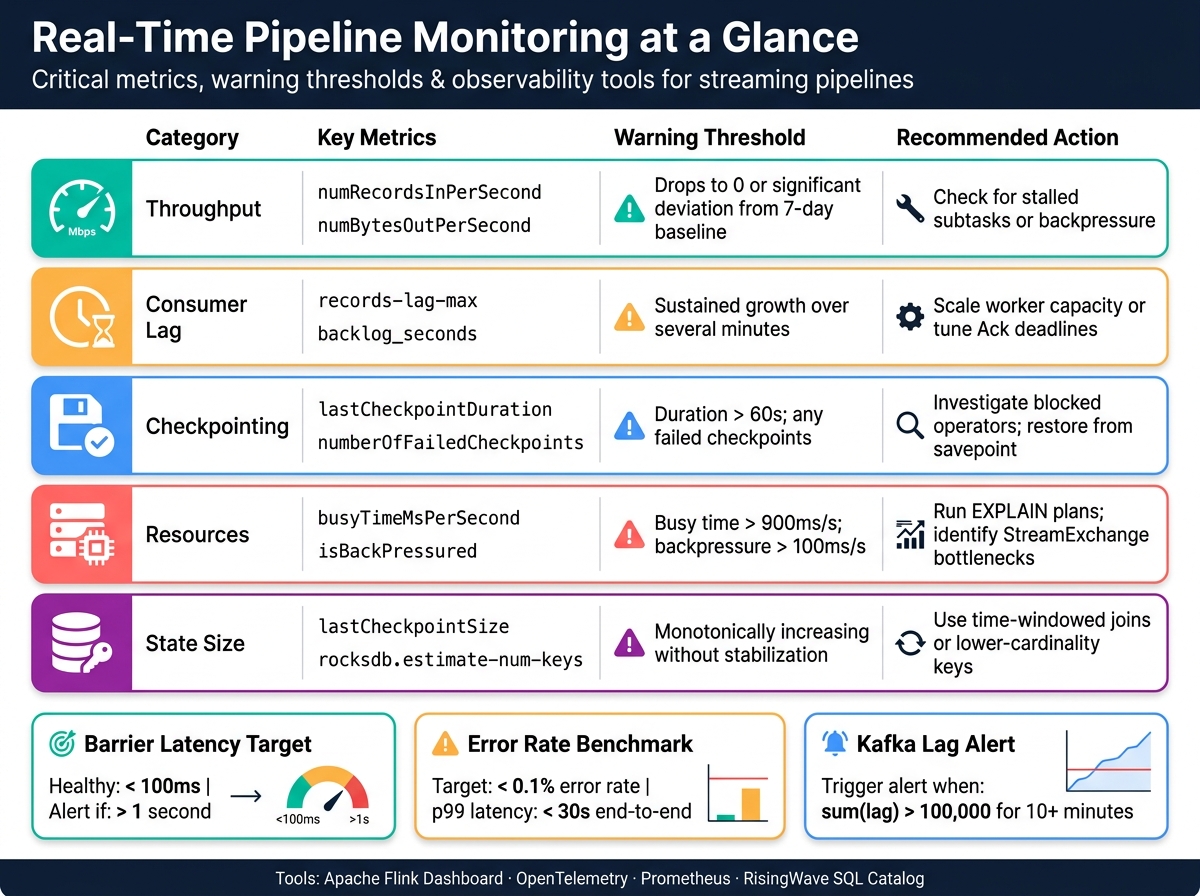
To maintain a healthy pipeline, aim for an error rate below 0.1% and a p99 end-to-end latency under 30 seconds. These benchmarks should be your starting point before diving into any debugging session.
"Monitoring streaming pipelines is fundamentally different from monitoring batch jobs. A batch job either finishes or fails. A streaming pipeline runs continuously, and problems manifest as gradual degradation." - Yuhao Su, RisingWave
Lastly, avoid debugging directly against production data. Always test transformation logic in a staging environment using representative sample data. This allows you to validate your business logic without risking widespread issues in a live stream. By preparing your environment this way, you’ll be ready to systematically tackle any problems that arise.
sbb-itb-903b5f2
Debug Real-time Pipelines
Monitoring and Observability
Real-Time Pipeline Failure Modes: Symptoms, Metrics & Fixes
Key Metrics and Logs to Track
The next step is identifying the right metrics to monitor.
"Streaming systems look healthy until they quietly stop being correct. Small shifts - hidden consumer lag, slow checkpoints, or a single partition with silent IO errors - turn real-time pipelines into unreliable, expensive batch replays." - beefed.ai
Consumer lag is one of the most actionable metrics to keep an eye on. If it starts climbing, it’s a clear sign your pipeline is falling behind. Combine this with throughput metrics at the operator level, such as numRecordsInPerSecond and numRecordsOutPerSecond. These provide a more detailed view than job-level throughput, which can sometimes mask issues like a stalled subtask.
For stateful pipelines, monitoring checkpoint health is equally important. In Apache Flink, metrics like lastCheckpointDuration and numberOfFailedCheckpoints are critical. If checkpoint durations exceed 60 seconds or you see three consecutive failures, it’s time to act. Also, watch for state size issues. Metrics like rocksdb.estimate-num-keys or lastCheckpointSize can signal unbounded growth, often caused by operators failing to clean up data.
On the logging side, structured JSON logs are invaluable. Include fields like trace_id, message_key, topic, partition, and offset. These make it easier to correlate logs with distributed traces, allowing you to reconstruct the journey of a specific event through your pipeline.
| Metric Category | Key Metrics | Warning Threshold |
|---|---|---|
| Throughput | numRecordsInPerSecond, numBytesOutPerSecond |
Drop to 0 or significant deviation from 7-day baseline |
| Lag | records-lag-max, backlog_seconds |
Sustained growth over several minutes |
| Checkpointing | lastCheckpointDuration, numberOfFailedCheckpoints |
Duration > 60s; any failed checkpoints |
| Resources | busyTimeMsPerSecond, isBackPressured |
Busy time > 900ms/s; backpressure > 100ms/s |
| State | lastCheckpointSize, rocksdb.estimate-num-keys |
Monotonically increasing without stabilization |
These metrics form the backbone of effective monitoring and pave the way for deeper insights with observability tools.
Observability Tools for Pipeline Debugging
Observability tools enhance your ability to debug by offering detailed, layer-specific insights. Spark UI is perfect for examining batch stages, spotting data skew, and reviewing executor logs. For streaming workloads, the Flink Dashboard is indispensable, providing real-time views of operator performance, backpressure, and checkpoint health.
For those using RisingWave, its system catalog tables allow you to query pipeline health directly via SQL. For instance, querying rw_catalog.rw_event_logs can reveal barrier latency and job status without needing external tools. This can be a lifesaver during incidents when quick triage is essential.
If your pipeline spans multiple systems - like Kafka producers, Flink tasks, and downstream sinks - OpenTelemetry with W3C traceparent headers is a game-changer. It enables end-to-end tracing, even across loosely coupled services. To keep Kafka client metrics organized, group them by client ID in your registry (e.g., using Micrometer).
"A Flink job that runs without monitoring is a time bomb. It might process millions of records per second today and silently fall behind tomorrow." - Streamkap
Setting Up Real-Time Alerts
Once you’ve identified the key metrics and tools, the next step is setting up real-time alerts to catch issues early. Focus on leading indicators to address problems before they escalate.
Set alerts for specific thresholds, such as Kafka’s sum(lag) exceeding 100,000 for 10 minutes, failedCheckpointCount > 0 for 5 minutes in Flink, or busyTimeMsPerSecond > 900 for any operator. For systems like RisingWave, alert when barrier durations average over 1 second - healthy systems typically stay under 100ms.
To avoid alert fatigue, tools like Alertmanager can group related alerts by cluster or service. Use inhibition rules to suppress low-priority alerts when a high-severity issue is already active. Reserve on-call pages for critical SLO breaches, such as 99% of events exceeding 500ms end-to-end latency. Non-critical alerts can simply notify a Slack channel for asynchronous review.
A lesser-known but effective strategy is the synthetic probe. This involves a low-frequency process that generates a test event, processes it, and verifies correctness every 20 seconds. Unlike internal metrics, this approach measures end-to-end availability from the client’s perspective, ensuring your pipeline isn’t just appearing healthy but actually functioning as expected.
Step-by-Step Debugging Workflow
Identifying and Scoping the Problem
"In stream processing, pipelines rarely fail loudly; instead, they stall."
Sometimes, a pipeline might show as "Running", but data flow has stopped - these silent failures can be tricky to catch. Look for telltale signs like a rising watermark age (the timestamp of the oldest unprocessed data), increasing backlog metrics such as oldest_unacked_message_age in Pub/Sub, or a sudden jump in system lag. For Google Cloud Dataflow, a watermark age exceeding 5 minutes is a red flag and should be treated as an urgent issue.
Once you confirm an issue, classify it. Is it a data quality problem (e.g., malformed records causing retries)? A resource issue (like OutOfMemoryError or disk running out)? Or perhaps a dependency failure (such as IAM permission issues or upstream timeouts)? Proper classification is key to determining your next steps.
| Failure Category | Key Diagnostic Indicators | Recommended Diagnostic Tool |
|---|---|---|
| Data Quality | Schema mismatch, null values, "poison pills" | Dead Letter Queue (DLQ), schema validation |
| Resource Exhaustion | OutOfMemoryError, worker crashes |
Worker logs, rw_table_stats |
| Backpressure | High barrier latency, rising system lag | EXPLAIN plans, rw_fragments |
| Dependency | Silent IAM denials, API timeouts | Circuit breakers, retry with backoff |
| Late Data | Stale materialized views, missing records | Watermark monitoring, rw_event_logs |
Once categorized, move on to a detailed investigation of logs and metrics.
Analyzing Logs and Metrics
After identifying the problem, avoid the common mistake of relying only on job-level logs. These logs usually cover lifecycle events like job start and failure but rarely point to the root cause. Instead, focus on worker-level logs, which contain the details you need - stack traces, type mismatches, or resource errors like OutOfMemoryError.
Use severity filters (e.g., severity>=ERROR, resource.type="dataflow_step") to zero in on critical issues. If your pipeline's error messages include Node IDs or Fragment IDs, use them to pinpoint the exact transformation stage causing the problem. This approach is far more efficient than manually sifting through endless log lines.
For streaming pipelines, running EXPLAIN on your queries can reveal expensive operations like StreamExchange or stateful joins that quietly consume resources. Even a single unexpected full scan can explain why your pipeline is lagging without triggering explicit errors.
"Barrier latency is the single most important metric for streaming pipeline health." - Yuhao Su, RisingWave
In a well-functioning system, barrier latency should stay below 100ms. If it exceeds 1 second, a blocked operator is likely the culprit.
Testing Fixes and Deploying Safely
Once you've analyzed the logs and identified the issue, test your solution in a controlled environment. Use representative and edge-case data, including the specific malformed record that caused the problem. Since real-time pipelines process data continuously, careful testing ensures you don't disrupt live traffic.
For critical fixes, consider setting up a parallel pipeline. This secondary pipeline can handle only the problematic time window or filter out bad data while the primary pipeline remains active. This approach minimizes downtime and allows you to compare the old and new behavior directly. Ensure your operations are idempotent to prevent duplicate records or inconsistent states during restarts.
When deploying fixes, use a rate limit at the ingestion point, such as SOURCE_RATE_LIMIT in RisingWave or throttling Kafka consumer groups. This prevents a sudden backlog from overwhelming downstream processes during the rollout. If schema changes are part of the fix, run automated schema evolution tests in your CI/CD pipeline and validate them at the pipeline boundary before letting data flow through. Always have a rollback plan in place, and know which savepoint or checkpoint to restore if the update causes unexpected issues.
Advanced Debugging Techniques and Best Practices
Building on standard debugging methods, advanced strategies help reduce downtime and make problem-solving more efficient.
Pipeline Architecture Patterns That Simplify Debugging
Creating effective pipelines starts with moving away from flat logs and adopting structured distributed tracing. This method captures causal chains - from LLM calls to planning decisions - so you can identify issues without needing to replay the entire pipeline. As engineer-founder Tian Pan explains:
"The bug you're hunting usually isn't in your Python code. It's in the model's interpretation of context at step four, which led it to pick the wrong tool at step six, which cascaded into a malformed API call at step eight."
To improve trace coverage, use OpenTelemetry GenAI semantic conventions, such as invoke_agent and execute_tool, and centralize instrumentation. This creates a consistent and clear view of your pipeline's behavior.
Once observability is improved, the next step is to focus on resilience to ensure pipeline stability.
Fault Tolerance and Resilience Techniques
After achieving traceability, resilience measures can help handle inevitable production errors. Building these safeguards into your pipeline early can save significant debugging time later. For instance, implement smart retry logic with exponential backoff and a same-error threshold to prevent repeated failures. Additionally, use a three-state circuit breaker (CLOSED → OPEN → HALF_OPEN) to isolate failing services and prevent cascading timeouts that could disrupt the entire pipeline.
A real-world example comes from Diagrid in April 2026. Their multi-agent event planning system faced concurrent 429 errors due to seven agents sharing a single OpenAI API quota. By using Catalyst's workflow graph, engineers identified the failure at a specific call_llm step caused by token-per-minute (TPM) exhaustion. They resolved the issue with Dapr resiliency policies, applying exponential backoff.
"Agents don't stop in production because errors happen. They stop because error recovery fails." - Antigravity Lab
Another key resilience strategy is automatic checkpointing. Configure your pipeline to save its last valid state upon failure, allowing you to resume from that point instead of starting over. Pair this with regular fault injection testing - like simulating 50% timeouts on search APIs - to ensure fallback mechanisms and circuit breakers work as expected.
Privacy-Aware Debugging for AI Pipelines
Debugging AI pipelines often involves sensitive data, making strong privacy controls essential. A key principle is to collect minimal data, keep it for the shortest time necessary, and always obtain explicit consent.
Use triggered diagnostics to capture only the failing request/response cycle, with user consent. Apply automated best-effort redaction to sensitive elements like prompts, tool outputs, and file paths before storing them, and limit data retention to about 14 days. Tools like NanoGPT help maintain privacy by storing data locally on the user's device, reducing exposure and keeping sensitive inputs off shared servers.
For deeper debugging without risking live environments, try the Replay-Diverge-Compare method. Load a production trace into a sandbox, replace live LLM and tool calls with deterministic stubs that mimic recorded outputs, and then tweak one variable - such as a prompt or model version - to pinpoint where execution diverges. This method ensures high-fidelity debugging while keeping production data secure. Interestingly, 88% of AI agent failures stem from infrastructure gaps rather than model quality, making investments in privacy-safe observability tools a worthwhile endeavor for long-term reliability.
Conclusion and Key Takeaways
Real-time pipeline debugging presents unique challenges compared to traditional software debugging. Unlike traditional approaches, you can’t pause or step through execution to replicate issues. Failures in real-time systems are often silent, causal, and distributed, which makes proactive measures like observability absolutely critical.
One of the most important lessons here is this: don’t wait for production failures to implement observability. Teams that prioritize early instrumentation - such as embedding trace IDs in every workflow - can cut investigation time by up to 40% during sprint cycles. This approach isn’t just theory; it’s a proven strategy embraced by industry leaders.
"Every production failure that doesn't become a pre-deployment test case is a regression waiting to recur - the production-to-eval loop is the highest-leverage quality investment."
When failures occur, the best course of action is to capture the full session trace immediately, before making any changes to the code or prompts. As discussed earlier, debugging AI agent failures can involve analyzing up to 15 tool calls over 8 conversation turns. These failures are especially tricky, as root causes are often buried and not visible in the output. Silent tool failures - where a tool provides a valid but misinterpreted response - are among the most elusive and impactful, often disrupting downstream reasoning in significant ways.
FAQs
How can I identify which operator is causing a pipeline stall?
To identify which operator is causing a pipeline stall, you can use diagnostics suited to your specific architecture:
- GStreamer pipelines: Leverage tools like GstShark tracers, such as
queuelevel, to monitor buffer congestion and pinpoint bottlenecks. - Streaming SQL pipelines: Dive into system catalog tables and study EXPLAIN plans to uncover inefficiencies in the query execution.
- Distributed systems: Review worker logs for stall alerts or timeout errors that could indicate the problematic operator.
- Kernel-level operations: Enforce synchronous execution to isolate and identify the instruction causing the issue.
Each method provides insights tailored to its environment, helping you tackle stalls effectively.
When should I use a DLQ vs. retries for bad events?
When dealing with transient errors - like network timeouts, temporary service disruptions, or rate-limiting - implement retries. Use exponential backoff with a retry cap to prevent overwhelming the affected services.
For persistent errors, such as malformed data, schema violations, or business logic issues, rely on a dead letter queue (DLQ). Additionally, route events to the DLQ after retrying transient errors to their limit. This helps maintain the flow of the pipeline without interruptions.
What’s the fastest way to debug an AI pipeline without exposing user data?
The fastest way to debug an AI pipeline while keeping sensitive data secure is through deterministic replay in a local, sandboxed setup. By recording production traces - such as inputs, LLM responses, and tool outputs - you can replay them as stubs to recreate failures in a controlled environment. This approach allows for safe examination of intermediate states without exposing sensitive information. Tools like NanoGPT enhance security by keeping all data stored locally, ensuring debugging can be done securely without relying on live service interactions.