
JAX Memory Management Q&A
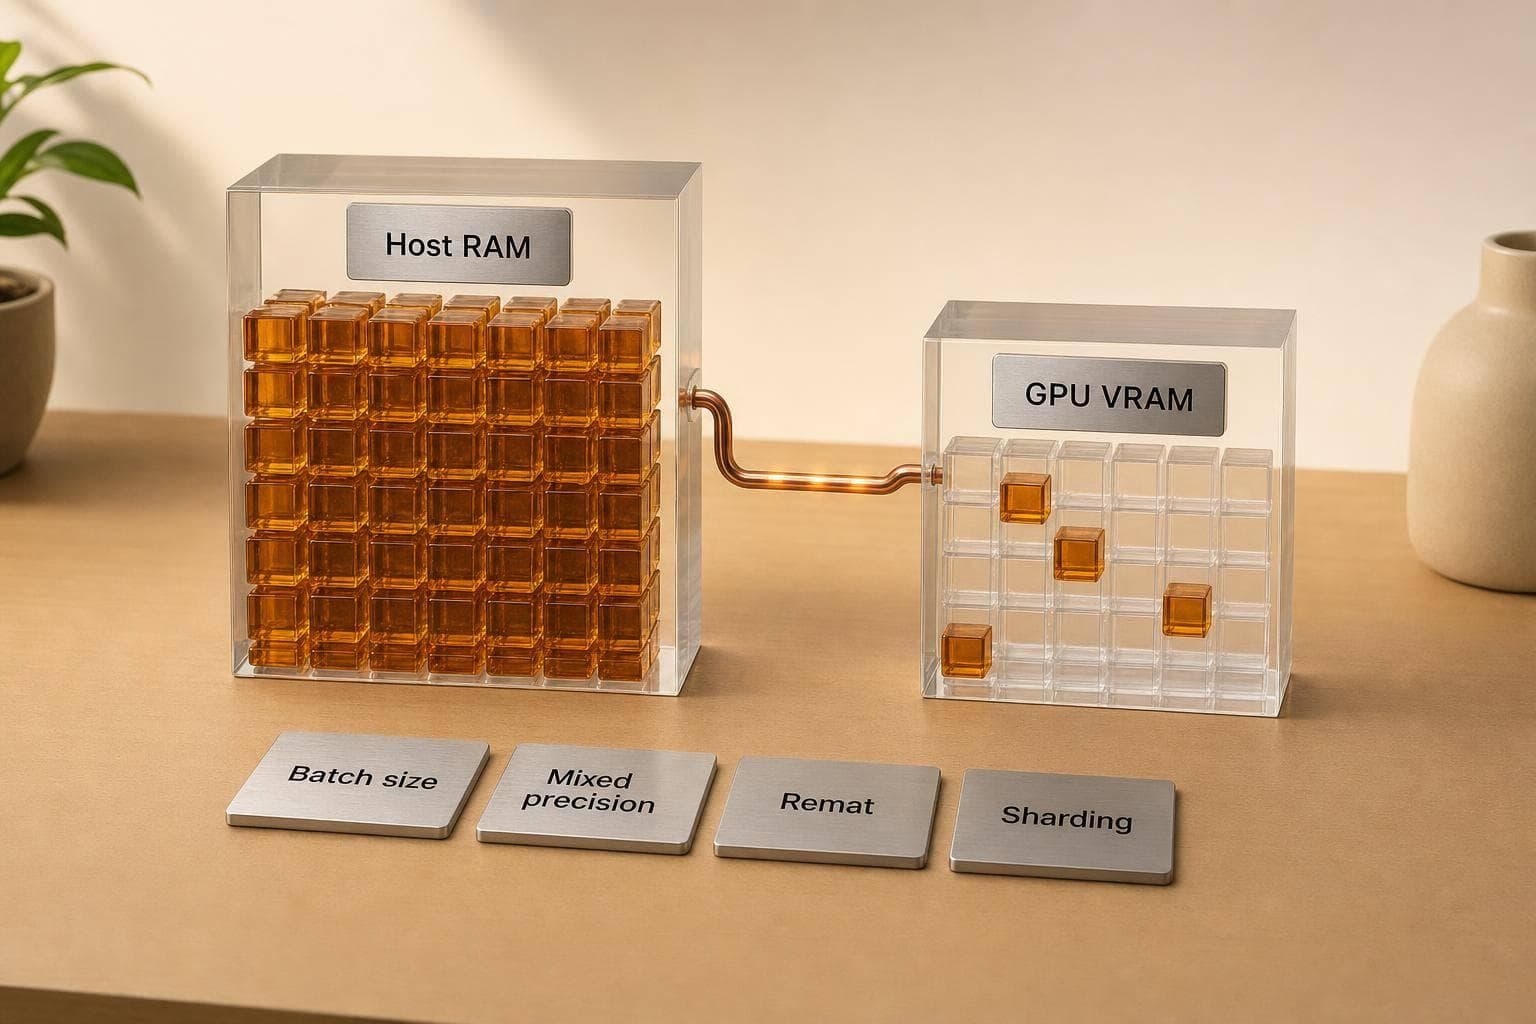
If JAX looks like it fills your GPU before training starts, that is often normal. By default, it reserves 75% of VRAM on first use, shape changes can trigger new compilations, and memory trouble usually comes from one of four places: preallocation, host vs. device mix-ups, recompilation, or replication instead of sharding.
If I wanted the short version, I’d keep it this simple:
- High GPU memory at startup does not always mean active tensor use
- GPU OOM and CPU RAM pressure are different problems
- Changing shapes can lead to extra compile time and memory use
- Batch size,
bfloat16, andjax.rematare the first fixes to try donate_argnumscan cut extra buffer copies in training stepspmapcopies model weights to each device, while sharding splits them across devices- On shared GPUs, preallocation settings often need to change
A few numbers matter most here:
- JAX usually preallocates 75% of GPU memory
- Mixed precision can cut activation memory by about 50%
- Two JAX jobs on one GPU can conflict fast if both try to reserve most of VRAM
Quick comparison
| Topic | What to know | First thing I’d check |
|---|---|---|
| Preallocation | JAX reserves a large VRAM pool at startup | XLA_PYTHON_CLIENT_PREALLOCATE |
| Device OOM | GPU/TPU memory is full | nvidia-smi, nvtop, JAX error |
| Host RAM pressure | CPU memory grows from data loading or compile artifacts | system RAM, swap, process memory |
| Recompilation | Shape changes can trigger new compiled programs | jax.log_compiles |
| Peak memory fixes | Lower activations and temp buffers | batch size, bfloat16, jax.remat |
| Multi-device fit | Replication and sharding have very different memory costs | pmap vs. NamedSharding |
The main idea: I’d debug JAX memory in this order - allocation, location, shapes, then sharding.
sbb-itb-903b5f2
How JAX and XLA Allocate Memory on GPUs and TPUs
Preallocation, memory pools, and why GPU memory looks full at startup
JAX reserves GPU memory up front to cut memory fragmentation. That reserved block is not the same thing as memory your tensors are using right now. So tools like nvidia-smi and nvtop can show high GPU usage even when the live tensors are much smaller than the reserved pool.
Host memory versus device memory in real workloads
It helps to separate host RAM from device memory, because they fail in different ways.
Device memory - HBM on TPUs or VRAM on GPUs - stores what the accelerator is working on: model parameters, gradients, and intermediate activations. Host RAM stores Python objects, datasets, and XLA compilation artifacts.
| What Lives Where | Host RAM (CPU) | Device Memory |
|---|---|---|
| Holds | Python objects, data loaders, XLA compilation artifacts | Model parameters, gradients, intermediate activations |
| OOM symptom | System slowdown, "Killed" process, swap usage spikes | JAX-specific OOM error, nvidia-smi shows full VRAM |
| Performance bottleneck | Slow data loading or excessive recompilation | HBM bandwidth saturation or arithmetic intensity |
JAX usually handles data movement for you. But if you need direct control over placement or sharding, use jax.device_put. That split - host RAM vs. device memory - is the first thing to check when you're trying to figure out where memory pressure is coming from.
How static shapes and compilation affect buffer reuse
Shapes matter more than people expect. When input shapes change, JAX may need to recompile, which adds overhead and can reduce buffer reuse. In workloads with changing sequence lengths, ahead-of-time (AOT) compilation for a fixed set of expected shapes can help you avoid paying that cost over and over during training.
Stable shapes also make memory behavior easier to predict before you start tuning preallocation or sharding.
Configuring JAX Memory Allocation and Avoiding Conflicts
Environment variables that control preallocation and memory limits
When JAX’s default GPU reservation causes trouble, you can change how much memory it grabs.
By default, JAX reserves 75% of GPU memory the first time it runs. That helps cut allocation overhead and fragmentation. But it can also lead to OOM errors if another process needs that memory.
Three environment variables control this behavior:
| Variable | What It Does | When To Use It |
|---|---|---|
XLA_PYTHON_CLIENT_PREALLOCATE | Set to "false" to turn off preallocation | On shared GPUs or when preallocation is causing memory conflicts |
XLA_PYTHON_CLIENT_MEM_FRACTION | Sets the fraction of VRAM JAX reserves | When you need to leave room for other processes |
XLA_PYTHON_CLIENT_ALLOCATOR | Set to "platform" to use on-demand allocation instead of a memory pool | When you want JAX to allocate memory as it needs it |
On a dedicated GPU, the default setting usually makes sense. On a shared GPU, it’s often better to lower the reserved fraction or turn preallocation off.
Running multiple JAX processes on one GPU without conflicts
If you run two JAX jobs on one GPU, both can try to reserve 75% of VRAM. That can block the second process from getting the memory it needs and trigger OOM errors.
For shared GPU use, set XLA_PYTHON_CLIENT_PREALLOCATE=false. That tells JAX to allocate memory as needed instead of claiming most of the GPU at startup. You can also lower XLA_PYTHON_CLIENT_MEM_FRACTION when you want to split GPU memory more carefully across jobs.
When these allocation settings still aren’t enough, the next step is to cut peak memory use.
Fixing Out-of-Memory Errors and Reducing Peak Memory Use
When allocation settings don't solve the problem, the next move is simple: lower peak memory use.
How to tell device OOM from host RAM pressure
Device OOM starts on the accelerator. You'll usually see VRAM or HBM maxed out in nvidia-smi or nvtop, and JAX will throw an allocation error.
Host RAM pressure looks different. It tends to show up on the CPU side during data loading or compilation, and in some cases the system will OOM-kill the process.
A good first check is jax.devices(). That tells you whether JAX sees the hardware you think it should. After that, turn on jax.log_compiles to spot surprise recompilations. If JIT keeps firing over and over, host memory can creep up in the background.
Once you know whether the problem is on the device or the host, use the smallest change that brings peak use down.
Quick fixes: batch size, mixed precision, and rematerialization
| Method | Pros | Cons |
|---|---|---|
| Batch Size Reduction | Safest first step; reduces memory linearly | Lower throughput; slower training |
| Mixed Precision (bfloat16/float16) | Cuts activation memory by about 50% and speeds up computation | Can require loss scaling |
| Gradient Checkpointing (remat) | Major memory savings for deep models like Transformers | Increases FLOPs; recomputes activations on the backward pass |
| Gradient Accumulation | Simulates large batch sizes on limited hardware | Increases total training time per effective batch |
Start with a smaller batch size. It's usually the safest fix, and it works fast.
Then look at mixed precision. On supported hardware, bfloat16 is often the better pick because it cuts activation memory without the stability issues that can come with float16. For models that eat memory - Transformers are a common case - use jax.checkpoint (jax.remat) to swap extra compute for lower activation memory.
You can also set checkpoint policies so JAX keeps expensive ops and recomputes the rest. That gives you a more targeted tradeoff instead of recomputing everything.
Gradient accumulation and cache management for long training runs
If a full batch won't fit, split it into micro-batches and accumulate gradients with optax.MultiSteps. This lets you train with a larger effective batch size even when memory is tight.
For longer runs, jax.clear_caches() can help keep host memory from climbing due to repeated compilations.
Next, see how JAX transformations and sharding change memory pressure across devices.
Using JAX Transformations and Sharding Without Wasting Memory
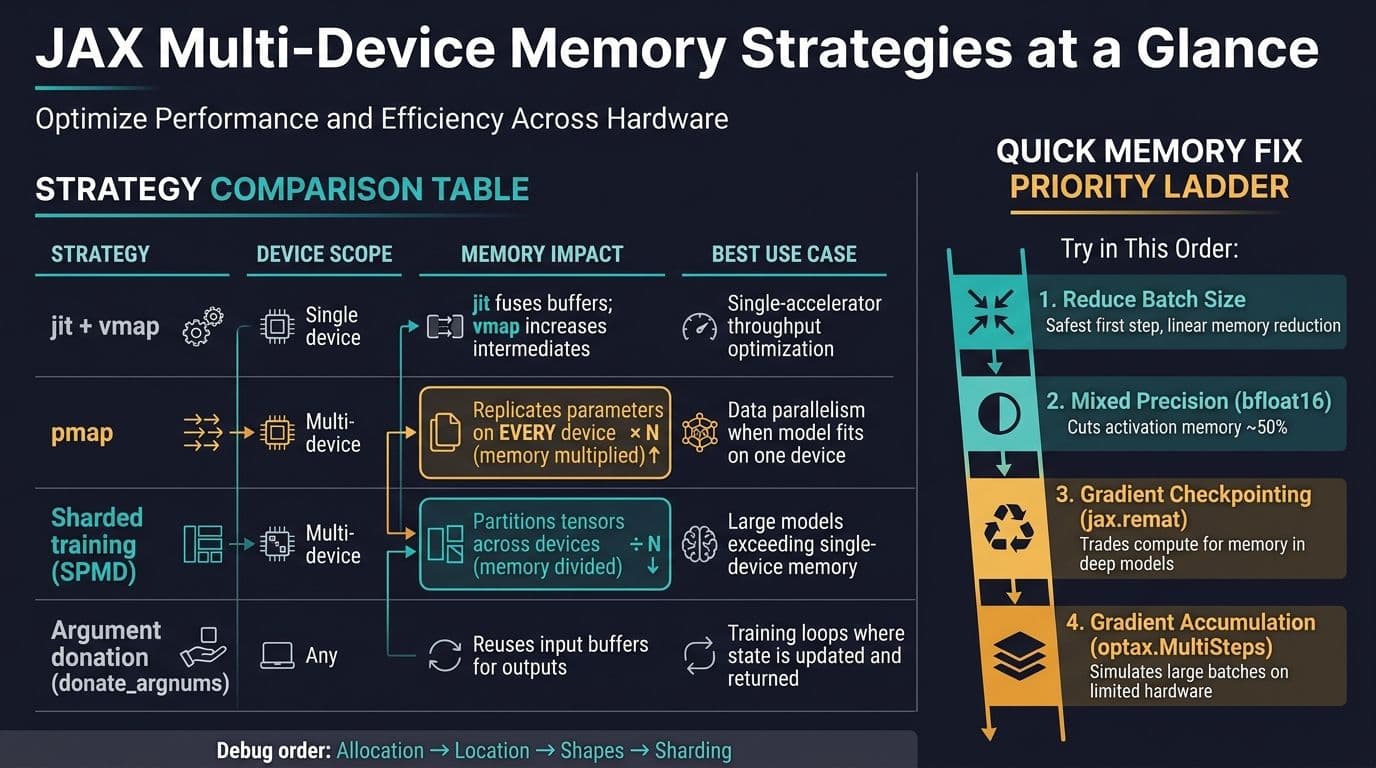
JAX Memory Management: Sharding vs. Replication & Key Fixes
When allocation settings stop helping, the next place to look is how JAX compiles functions, reuses buffers, and splits data across devices.
How jit and donate_argnums lower memory pressure
jax.jit can help trim memory use because it fuses ops and reuses buffers. That often lowers peak device memory during execution.
For training loops, buffer donation takes that one step further. donate_argnums tells JAX that an input buffer won't be needed after the function finishes. That gives XLA room to overwrite that buffer with the output instead of making a new allocation. In practice, this is a good fit for train_step, where the training state gets updated and returned on every step.
Why vmap, pmap, and replication can increase peak memory
jax.vmap is handy, but there's a catch: it materializes batch intermediates at the same time. So as batch size grows, intermediate activations grow with it, and peak memory can jump faster than a plain sequential loop might suggest.
jax.pmap has a different cost. By default, it replicates model parameters on every device. If the model is large, you're not spreading those weights across devices - you’re copying them onto each one. That means the memory footprint gets multiplied per device instead of divided.
Sharding patterns for fitting larger models on available hardware
If the model still doesn't fit on one device, buffer reuse won't be enough. At that point, you need partitioning.
Use sharding when the model is too large for a single device. With NamedSharding and PartitionSpec, you can partition tensors across devices. Each device stores only its own slice of a weight matrix, which cuts per-device memory by roughly the same factor as the partitioning scheme.
Here's a side-by-side view:
| Strategy | Device Scope | Memory Impact | Best Use Case |
|---|---|---|---|
| jit + vmap | Single device | jit fuses buffers; vmap increases intermediates | Single-accelerator throughput optimization |
| pmap | Multi-device | Replicates parameters on every device | Data parallelism when the model fits on one device |
| Sharded training (SPMD) | Multi-device | Partitions tensors across devices | Large models that exceed single-device memory |
| Argument donation | Any | Reuses input buffers for outputs | Training loops where state is updated and returned |
Under SPMD, JAX handles communication collectives like AllReduce for you, so you don't need to wire up synchronization by hand.
Conclusion: JAX Memory Rules That Prevent Most Problems
Most JAX memory problems come down to four things: preallocation, host/device mix-ups, recompilation from shape changes, and replication when you should shard instead. A simple way to check them is this: allocation, location, shapes, then sharding.
Start with preallocation. By default, JAX grabs 75% of GPU memory the first time you use it. On shared GPUs, lower XLA_PYTHON_CLIENT_MEM_FRACTION so one process doesn’t crowd out everything else.
If memory still spikes after allocation tuning, figure out where the pressure is coming from before you touch batch size or allocator settings. Is it the GPU, or is it the host? That one detail changes what you do next.
Prefer stable shapes, mixed precision, and rematerialization. Keeping input shapes consistent helps you avoid recompilation spikes. Using bfloat16 can cut model memory by about half. If activations are the main problem, add jax.remat. And if your target batch size is bigger than what fits in HBM, use gradient accumulation.
If the model still does not fit, replicate only when the full model fits on each device. If it doesn’t, shard it across a device mesh.
At the end of the day, most JAX memory issues are just allocation tradeoffs you can see once you look in the right place. When allocation and peak memory are clear, the next move is usually pretty obvious.