
Scaling AI Validation Across Data Centers

If I validate AI in only one data center, I’m leaving gaps everywhere else. A model can look good offline, pass staging, and still miss a p95 latency target under 300 ms in one U.S. region, drift in another, or fail safety checks after rollout.
Here’s the short version:
- I need to validate three layers at once: model, data, and infrastructure
- I need three stages of checks: offline evaluation, pre-deployment validation, and production monitoring
- I should use the same datasets, containers, scorers, and thresholds across regions
- I need region-level tracking for p50/p95/p99 latency, error rates, drift, hallucination rate, PII redaction, and cost per run in USD
- I should gate releases with hard rules, such as:
- stop if p95 latency jumps by more than 20%
- stop if safety issues double per 10,000 requests
- flag drift when PSI > 0.2
- I should test failure paths in live systems with:
- chaos tests
- load tests at 1.5–2× peak
- 1%–5% canaries by region
- I need clear owners for each problem:
- Data Science for benchmarks and drift limits
- Platform Engineering for runtime and deployment standards
- SRE for incidents
- Compliance for policy and audit logs
In other words: one benchmark is not enough. I need one shared validation system that checks every region the same way, watches for drift and failures after launch, and rolls back fast when a gate is missed.
Below, I’ll walk through the setup in plain English so you can turn multi-region AI validation into a repeatable process instead of a one-site test.
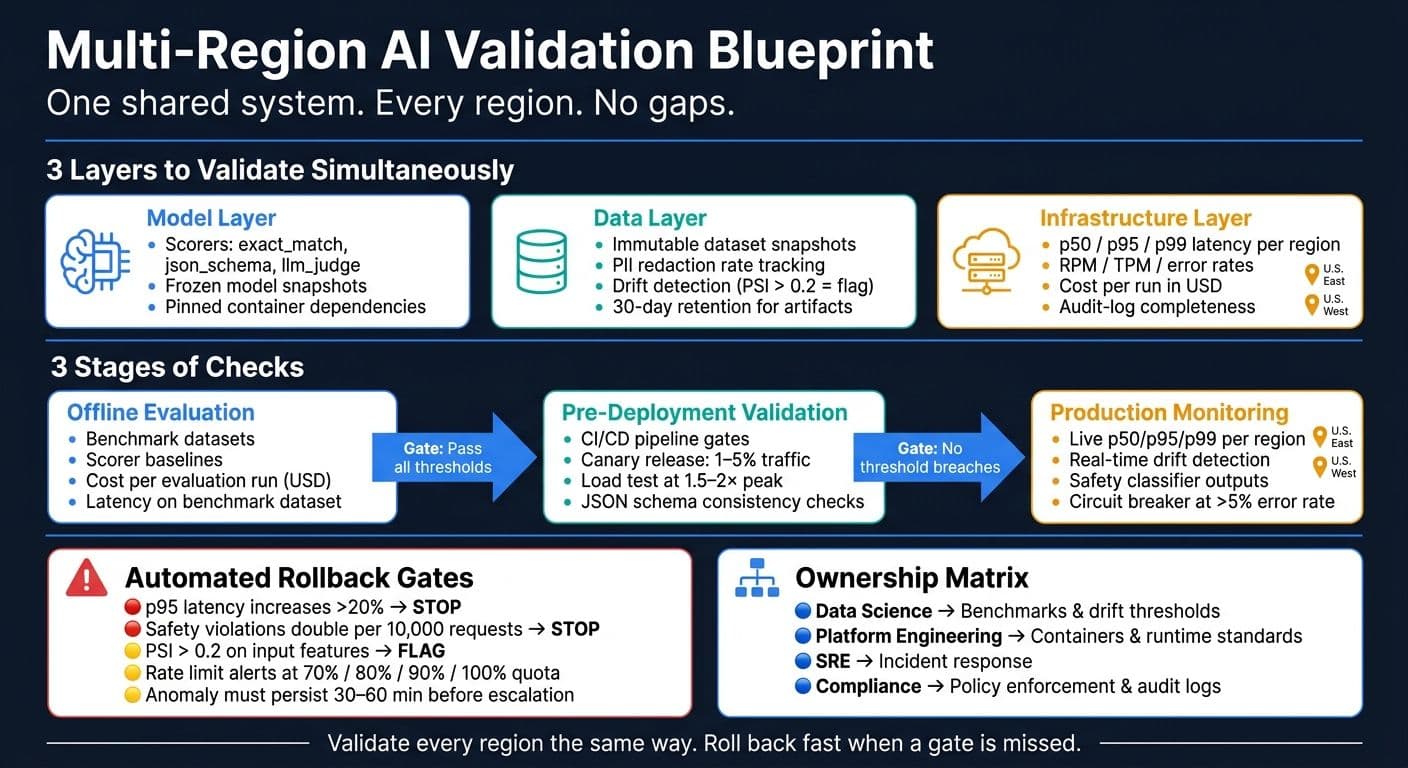
Multi-Region AI Validation: 3 Layers, 3 Stages & Key Gates
Cross-Region AI Model Deployment for Resiliency and Compliance
Design the Validation Architecture Before Picking Tools
Map out how signals move across sites before you choose the stack. Start with frozen snapshots of the dataset, model, and scorers so you can move cleanly from training to evaluation, deployment, and monitoring. That gives you one baseline across regions, which makes model, data, and infrastructure signals line up instead of drifting apart.
Standardize Environments With Containers, Kubernetes, and a Shared Model Registry
For model validation, consistency across sites is the main job. If library versions, preprocessing steps, or hardware drivers change from one data center to another, the results stop meaning the same thing. Containers fix that by turning the runtime environment into part of the artifact. In plain English: every evaluation job runs in the same image with pinned dependencies.
Kubernetes then handles scheduling across sites, and a shared model registry keeps versions in sync. Roll out updates gradually by region to cut the risk of quality slips and cost spikes.
You also need a standard scorer set that every data center supports. For example:
exact_matchjson_schemavalidationllm_judge
Set that standard early. Then a pass in one region means the same thing in every other region.
Use Distributed Datasets and a Central Observability Layer Across Sites
For data validation, freeze evaluation datasets into immutable snapshots so each site scores the exact same inputs. That snapshot becomes the formal handoff between data engineering and evaluation teams.
For infrastructure validation, use one observability layer to pull signals from distributed runs into a single place. Here are the inputs that layer needs from each validation surface:
| Layer | Observability Inputs |
|---|---|
| Model Metrics | Scores (LLM judge, exact match), token usage (prompt/completion), model and prompt configuration snapshots |
| Data Quality Signals | Dataset version IDs, scorer trends, error rates, PII redaction status, content suppression reasons |
| Infrastructure Telemetry | Experiment status (queued/in-progress/failed), trace status, rate limit errors, regional latency, p50/p95 latency, internal server failures |
Use opt-in production tracing for selected requests, with metadata tags like nanogpt_eval_trace_group to mark those requests. That keeps cost and noise down in the central metrics layer, while still letting production traces map back to the same evaluation run in every region. Set 30-day retention for trace records and experiment artifacts so cleanup works the same way across sites.
With the architecture fixed, define regional metrics and gates next.
Define Metrics, Gates, and Pipelines That Work Across Regions
Once observability is in place, use one shared set of thresholds for every region. That way, a pass in one region means the same thing as a pass somewhere else. The key is to use the same regional baselines from the observability layer so each pass/fail call stays comparable.
Track Performance, Safety, and Cross-Region Consistency Metrics
Track p50/p95/p99 latency, RPM, TPM, and error rates by region. Each metric should point to a clear type of failure, like latency skew, rate-limit saturation, compliance drift, or a regional latency delta. Cost matters just as much here. Measure cost per run in USD, not only cost per token, so you get a more honest side-by-side view across sites. Also track PII redaction rate and audit-log completeness as safety checks you can measure.
Offline benchmarks and live traffic should feed the same control loop. Same metrics, different thresholds.
| Metric Group | Offline Validation | Online Monitoring |
|---|---|---|
| Latency | p50/p95/p99 on benchmark dataset | Live p50/p95/p99 per region |
| Throughput | RPM/TPM against provider tier limits | Real-time rate limit consumption |
| Error Rate | Invalid output rate | Circuit breaker triggers (>5% error rate) |
| Cost | Cost per evaluation run (USD) | Cost per workload (USD) in production |
| Safety | PII redaction checks | Audit-log completeness |
| Regional Latency Delta | Latency by region on benchmark runs | Latency delta between regions |
Once those thresholds are set, connect them directly to the release flow.
Add Validation Gates to CI/CD and MLOps Pipelines
Metrics don't do much on their own. Something has to act on them. That's where gates come in. They are automated checkpoints that stop a model from moving to the next stage if it misses a threshold.
This stage-by-stage setup ties each pipeline step to a validation action and the data-center-specific issue it helps prevent:
| Pipeline Stage | Validation Action | Data-Center-Specific Concern |
|---|---|---|
| Edge Routing | Health checks every 10 seconds | Regional latency (p99 < 2 seconds) |
| Abstraction Layer | Validate JSON schema consistency | Provider-specific rate limits |
| Caching Layer | Near-duplicate detection | Cache poisoning & PII scoping |
| Fallback Chain | Trigger fallback | Cross-region data transfer costs |
| Post-Deployment | Audit logging & PII check | Regional compliance requirements |
For the caching layer, use cosine similarity of 0.92–0.95 to deduplicate near-identical requests. That can cut waste without being too loose. And the savings can add up fast: a cache with a 40% hit rate can reduce AI API costs by 40%.
It also helps to set alerts before things go sideways. Trigger rate limit alerts at 70%, 80%, 90%, and 100% of quota so teams get warning time before a hard cap blocks traffic.
sbb-itb-903b5f2
Test Failures, Drift, and Cross-Region Reliability in Production
Production validation finds the stuff that never shows up in staging. Real traffic, regional outages, and slow behavior changes have a way of slipping past pre-release gates. Once those gates are set, production testing has to catch the failures they miss.
Run Chaos Tests, Load Tests, and Canary Releases Across Data Centers
Start with network loss and latency spikes. Then test node or GPU failures. After that, hit gateway errors like 5xx bursts or mixed-version routing. That order matters: network and gateway failures tend to happen more often and do more damage, then you get resource exhaustion, then quieter dependency issues like an upstream embedding service getting worse.
Chaos tests and load tests should work side by side. A node failure under idle traffic doesn't tell you much. Run that same failure while synthetic load is at 1.5–2× your expected peak, and now you can see whether autoscaling and failover hold up when traffic is heavy.
This is infrastructure validation under live conditions. Region-scoped canaries take that one step further by checking model behavior under real traffic. Start with 1–5% of traffic in one region, such as U.S. East, keep everyone else on the stable version, and compare latency distributions, error rates, and output quality. Set rollback thresholds before launch. For example:
- Stop if p95 latency goes up by more than 20%
- Stop if safety violations double per 10,000 requests
Pair canaries with a version-controlled golden dataset built from actual production failures. Replay that dataset against every new candidate before you expand to more regions.
| Test Type | Goal | Validation Method | Data Center Applicability |
|---|---|---|---|
| Chaos (network) | Validate resilience to packet loss and latency spikes | Inject loss; monitor error and timeout rates | All regions; cross-region links |
| Chaos (node/pod) | Ensure failover under compute failures | Kill nodes or pods; verify auto-recovery and routing | Each cluster; zonal failures |
| Chaos (gateway) | Test routing consistency across versions | Simulate 5xx errors; check model version parity | Inference gateways per region |
| Load testing | Validate scaling under traffic spikes | Synthetic peak traffic at 1.5–2× expected load | U.S. primary regions first |
| Canary release | Limit blast radius of new model versions | 1–5% traffic slice; compare metrics vs. stable baseline | Per-region, then global expansion |
Detect Data Drift, Concept Drift, and LLM Safety Regressions Early
Fault injection protects availability. Drift monitoring protects correctness.
Data drift means the input distribution changes. Concept drift means the relationship between input and correct output changes. LLM safety regressions show up as more hallucinations, privacy leaks, or policy violations after an update.
A U.S. East data center may show drift sooner, or in a different way, than U.S. West if those regions serve different user groups. That's why centralized monitoring with region-tagged signals matters. This is data validation in production.
For data drift, use statistical distance measures such as Population Stability Index (PSI) or Kolmogorov–Smirnov statistics on a rolling 24-hour window against your reference distribution. Flag it when PSI exceeds 0.2 on key features. For concept drift, watch downstream KPIs like conversion rate, fraud capture rate, and satisfaction scores, then rule out seasonal or event-driven causes before you act. For safety regressions, pass outputs through safety classifiers for toxicity and privacy leaks, and run factuality checks for regulated topics like financial or medical queries.
You also want signal correlation, or you'll drown in alerts. Page people only when drift, performance, and safety signals move at the same time. Require anomalies to last 30–60 minutes before escalation. Use severity tiers so mild drift creates an informational alert, while a toxicity spike above a hard threshold pages the on-call team right away.
Feed these signals into region-level owners and rollback automation.
| Drift / Regression Type | Detection Signal | Response Action |
|---|---|---|
| Data drift | PSI > 0.2 or K-S stat on input features | Fix data pipelines; adjust sampling; retrain with recent data |
| Concept drift | KPI degradation; output pattern shifts | Retrain or fine-tune; update labels; revise feature set |
| LLM hallucination drift | Increased factual errors vs. reference sets | Strengthen grounding; update prompts; add retrieval layer |
| Safety regressions | More policy violations; higher toxicity scores | Tighten safety filters; revert model version; update policies |
| Quality regression | Lower coherence scores; shorter or longer completions than baseline | Tune prompts; reweight model variants; refine evaluation criteria |
These signals only help if ownership, SLOs, and policy controls are clearly assigned.
Governance, Privacy, and Conclusion
Assign Ownership, SLOs, and Policy Controls for Distributed Validation
Once validation signals go live, ownership needs to be clear right away. If it isn't, alerts sit there and nothing moves.
Here's the split:
- Data Science owns benchmark definitions and drift thresholds.
- Platform Engineering owns infrastructure and container standards.
- SRE owns incident response, platform owns infrastructure health, and compliance owns policy enforcement.
Escalation paths should be documented before an incident starts, not while people are scrambling to figure out who does what.
| Governance Artifact | Primary Owner | Role in Reliable Validation |
|---|---|---|
| Benchmark Definitions | Data Science | Ensures model accuracy and safety hold across regions |
| Approval Gates | Compliance / DS | Validates model safety and PII compliance before release |
| Audit Trails | Compliance | Maintains logs of all AI requests for regulatory traceability |
Governance should also require scheduled resilience checks. That's the part that keeps policy from turning into shelfware.
Where NanoGPT Fits for Privacy-Focused Multi-Model Validation

Privacy matters most when validation covers sensitive prompts across many models. That's where NanoGPT fits well.
It gives teams access to multiple models while keeping prompts and outputs stored locally. It can also centralize model access, logging, metrics, and cost tracking.
In plain English: teams get one place to manage validation work without sending sensitive data all over the place.
Conclusion: A Minimum Reliable Blueprint for Scaling AI Validation
With ownership and privacy controls in place, the system stays auditable as it scales. The goal is simple: define one standard, enforce it everywhere, and assign a clear owner for each failure mode.
Drift monitoring and chaos testing catch issues that pre-release gates miss across the model, data, and infrastructure layers. Governance - clear ownership, written SLOs, and audit trails - keeps the whole system accountable over time.
Together, these pieces create a validation operating model that stays reliable as your data center footprint grows.
FAQs
Why isn’t one data center enough for AI validation?
One data center isn't enough to support the speed, uptime, and global coverage modern AI apps need. If users are far from that one location, latency goes up fast, and that can hurt engagement.
There's another problem too: a single data center creates one point of failure. When validation is spread across regions, teams can support failover and handle traffic as it shifts in real time. That helps cut bottlenecks when demand suddenly spikes.
Which metrics matter most across regions?
Prioritize metrics that protect both operations and model quality across data centers.
Focus on:
- latency, especially p99, and throughput
- token usage, error rates, GPU load, and queue sizes
- accuracy, perplexity, factuality, calibration, and drift
These metrics help you keep the user experience steady, spot bottlenecks before they snowball, control costs, and catch cases where regional data differences call for model changes.
How do I catch drift and safety issues early?
Use continuous monitoring to track performance metrics and data quality. Since ground-truth labels can take days to show up, lean on proxy indicators like PSI: below 0.1 usually points to stability, while above 0.2 means it’s time to investigate.
For safety, put real-time guardrails in place to validate outputs and catch prompt injections or toxicity. It also helps to set tiered alerts, so critical failures and major performance drops get attention first, before users feel the impact.